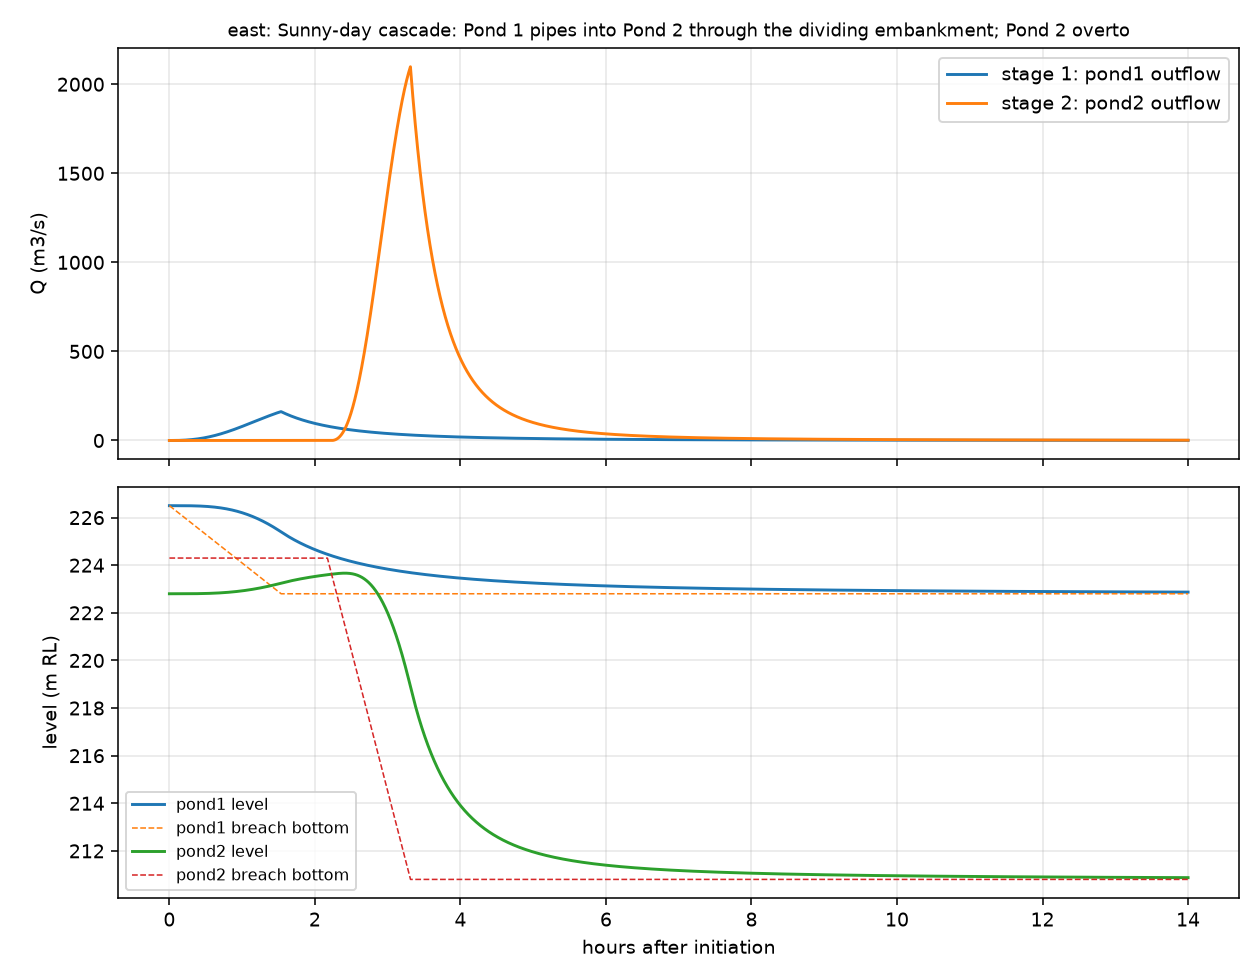
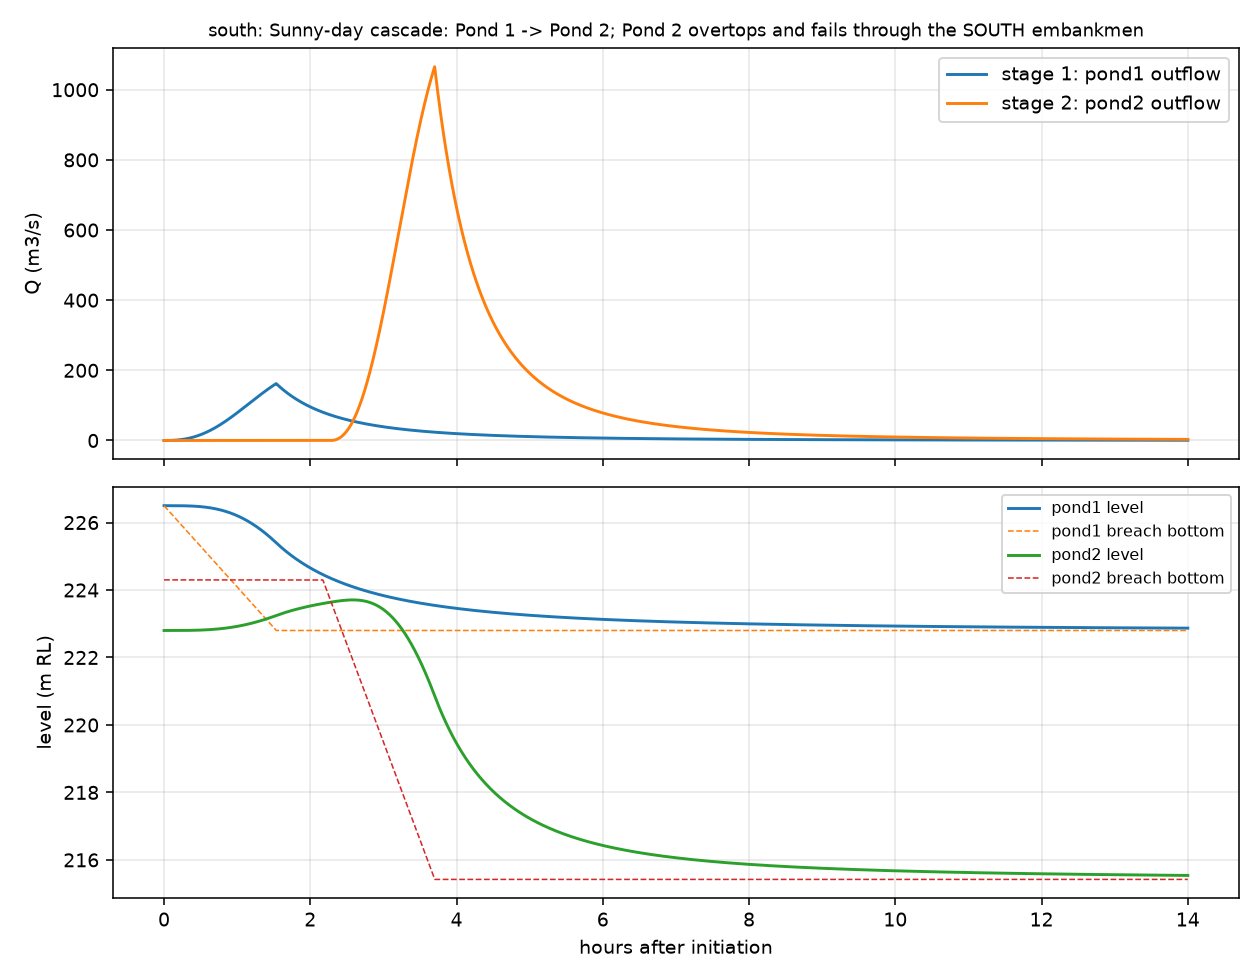
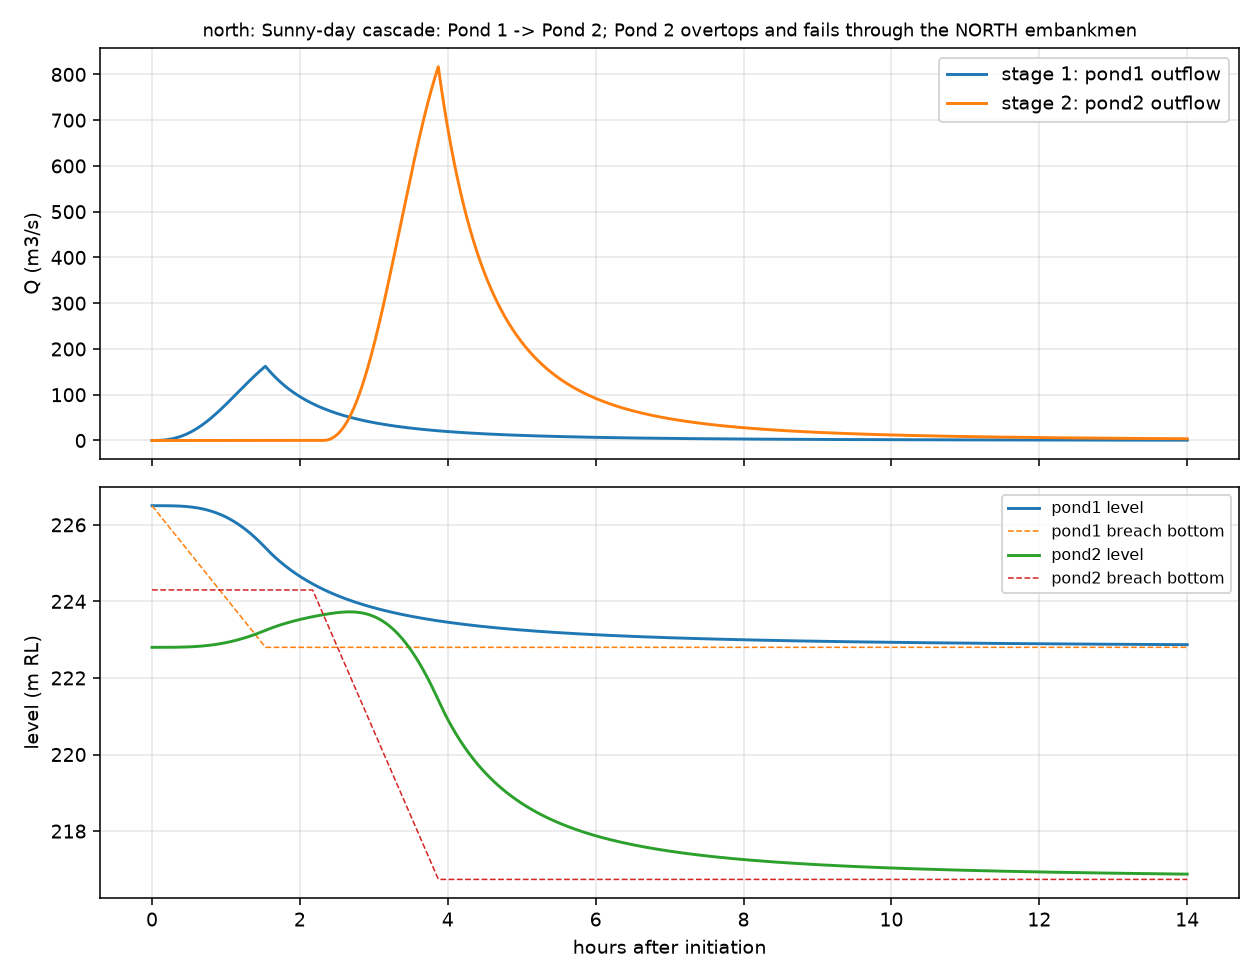
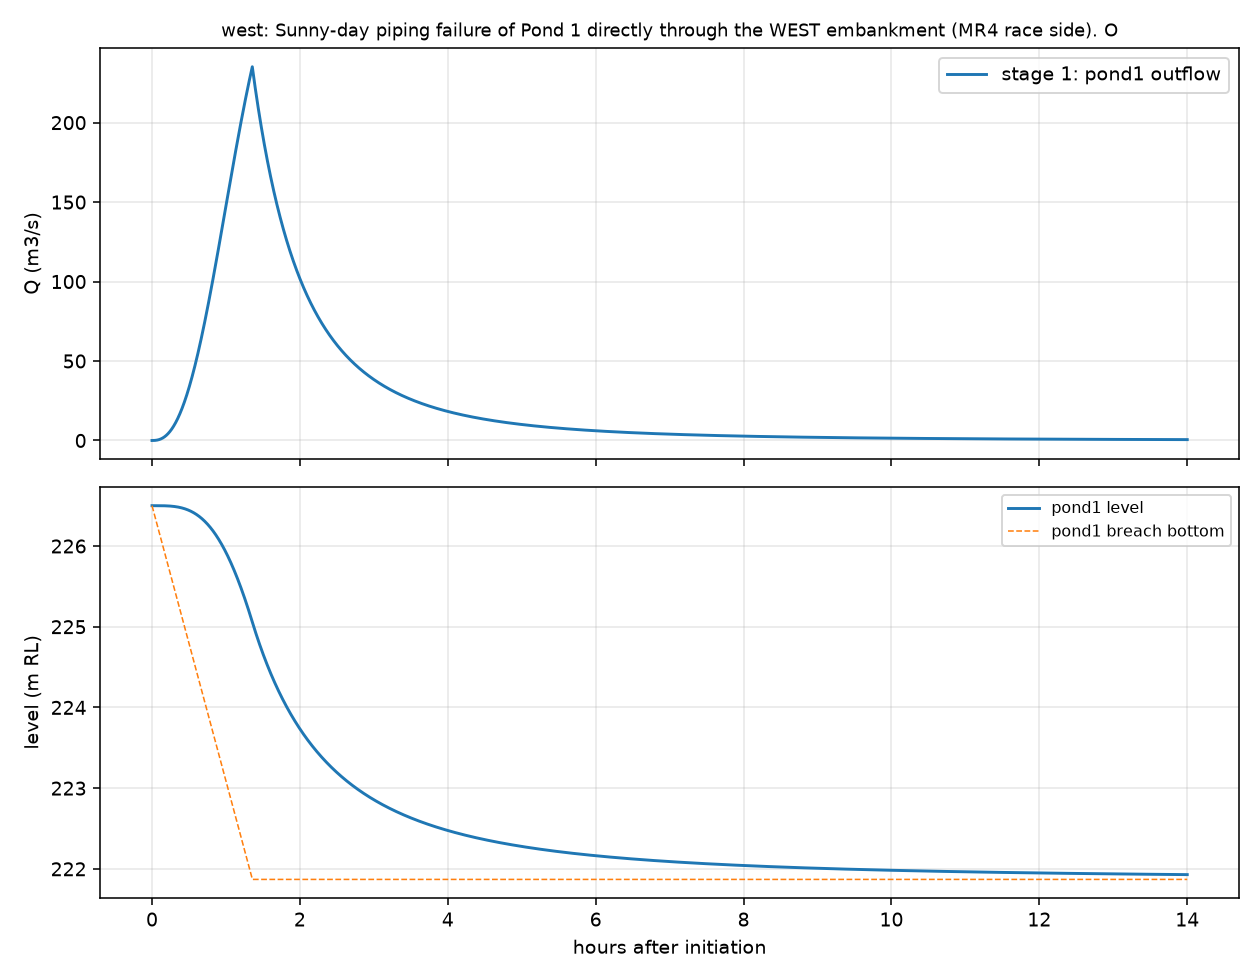
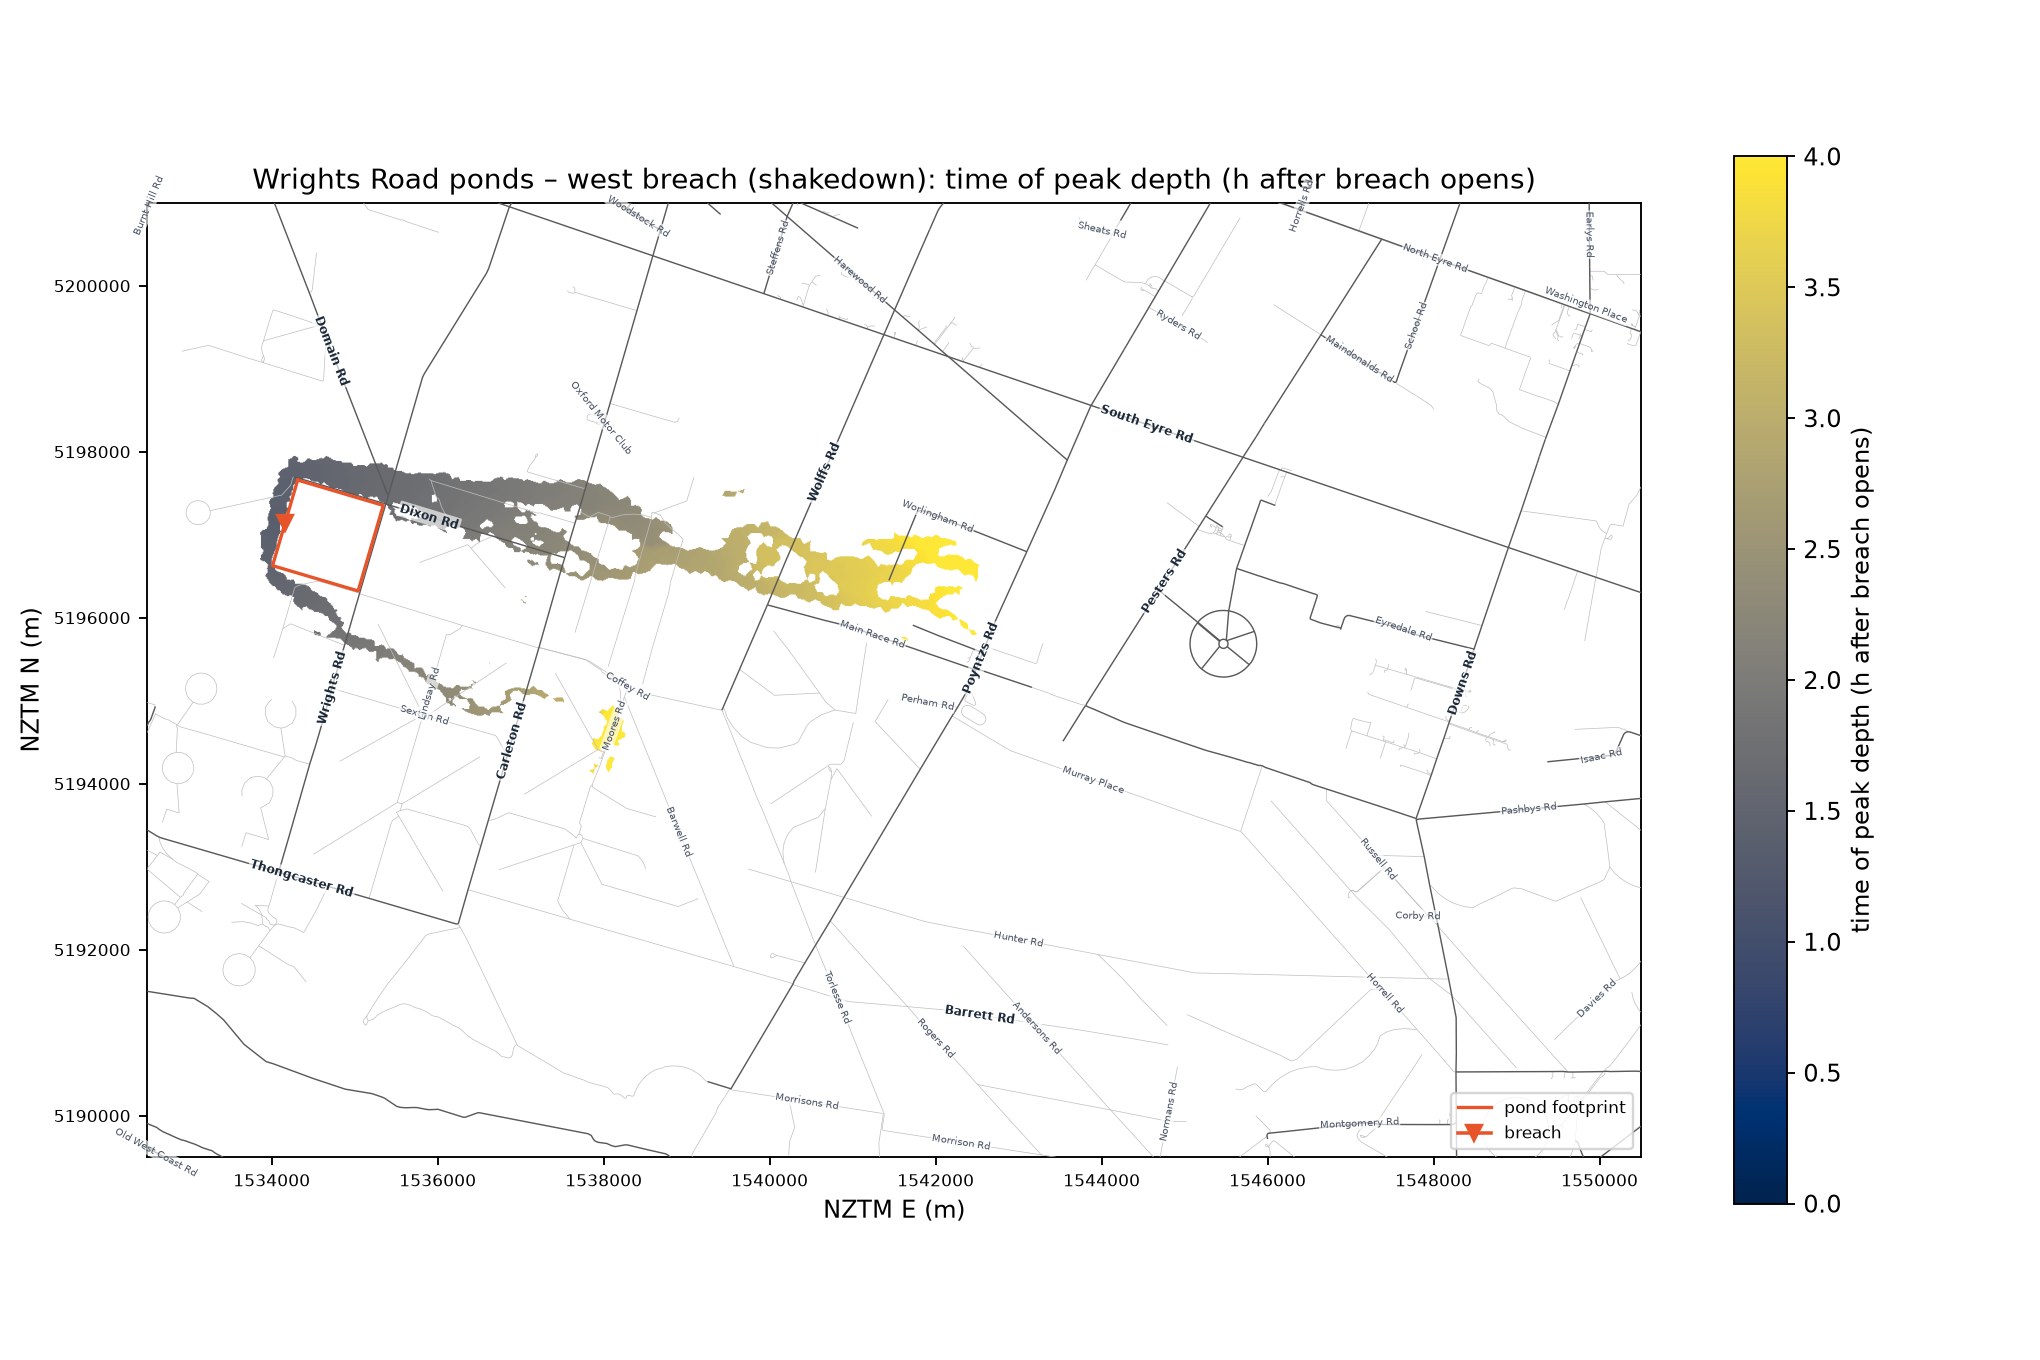
Screening-level results. Method, assumptions and caveats: SPEC.md §3 and §7.3; sources: docs/source-notes.md. Time zero for all 2D results is the moment the external (downstream) breach opens; for cascade scenarios that is 2.2 h after the Pond 1 failure begins.
| Scenario | Mechanism | Breach invert (LiDAR toe, m NZVD2016) | Peak outflow (m³/s) | Time to peak (h) | Volume released (Mm³) | Froehlich 1995 check (m³/s) |
|---|---|---|---|---|---|---|
| east | Pond 1 → Pond 2 cascade, overtopping | 210.8 | 2,098 | 1.1 | 7.18 | 1,484 |
| south | Pond 1 → Pond 2 cascade, overtopping | 215.4 | 1,066 | 1.5 | 5.34 | 777 |
| north | Pond 1 → Pond 2 cascade, overtopping | 216.7 | 817 | 1.7 | 4.68 | 600 |
| west | Pond 1 piping | 221.9 | 235 | 1.4 | 1.24 | 256 |
Damwatch (design report s3): "approximately 2,500 m³/s" for the type of breach analysed.
| Metric | East | West | Damwatch 2012 (E / W) |
|---|---|---|---|
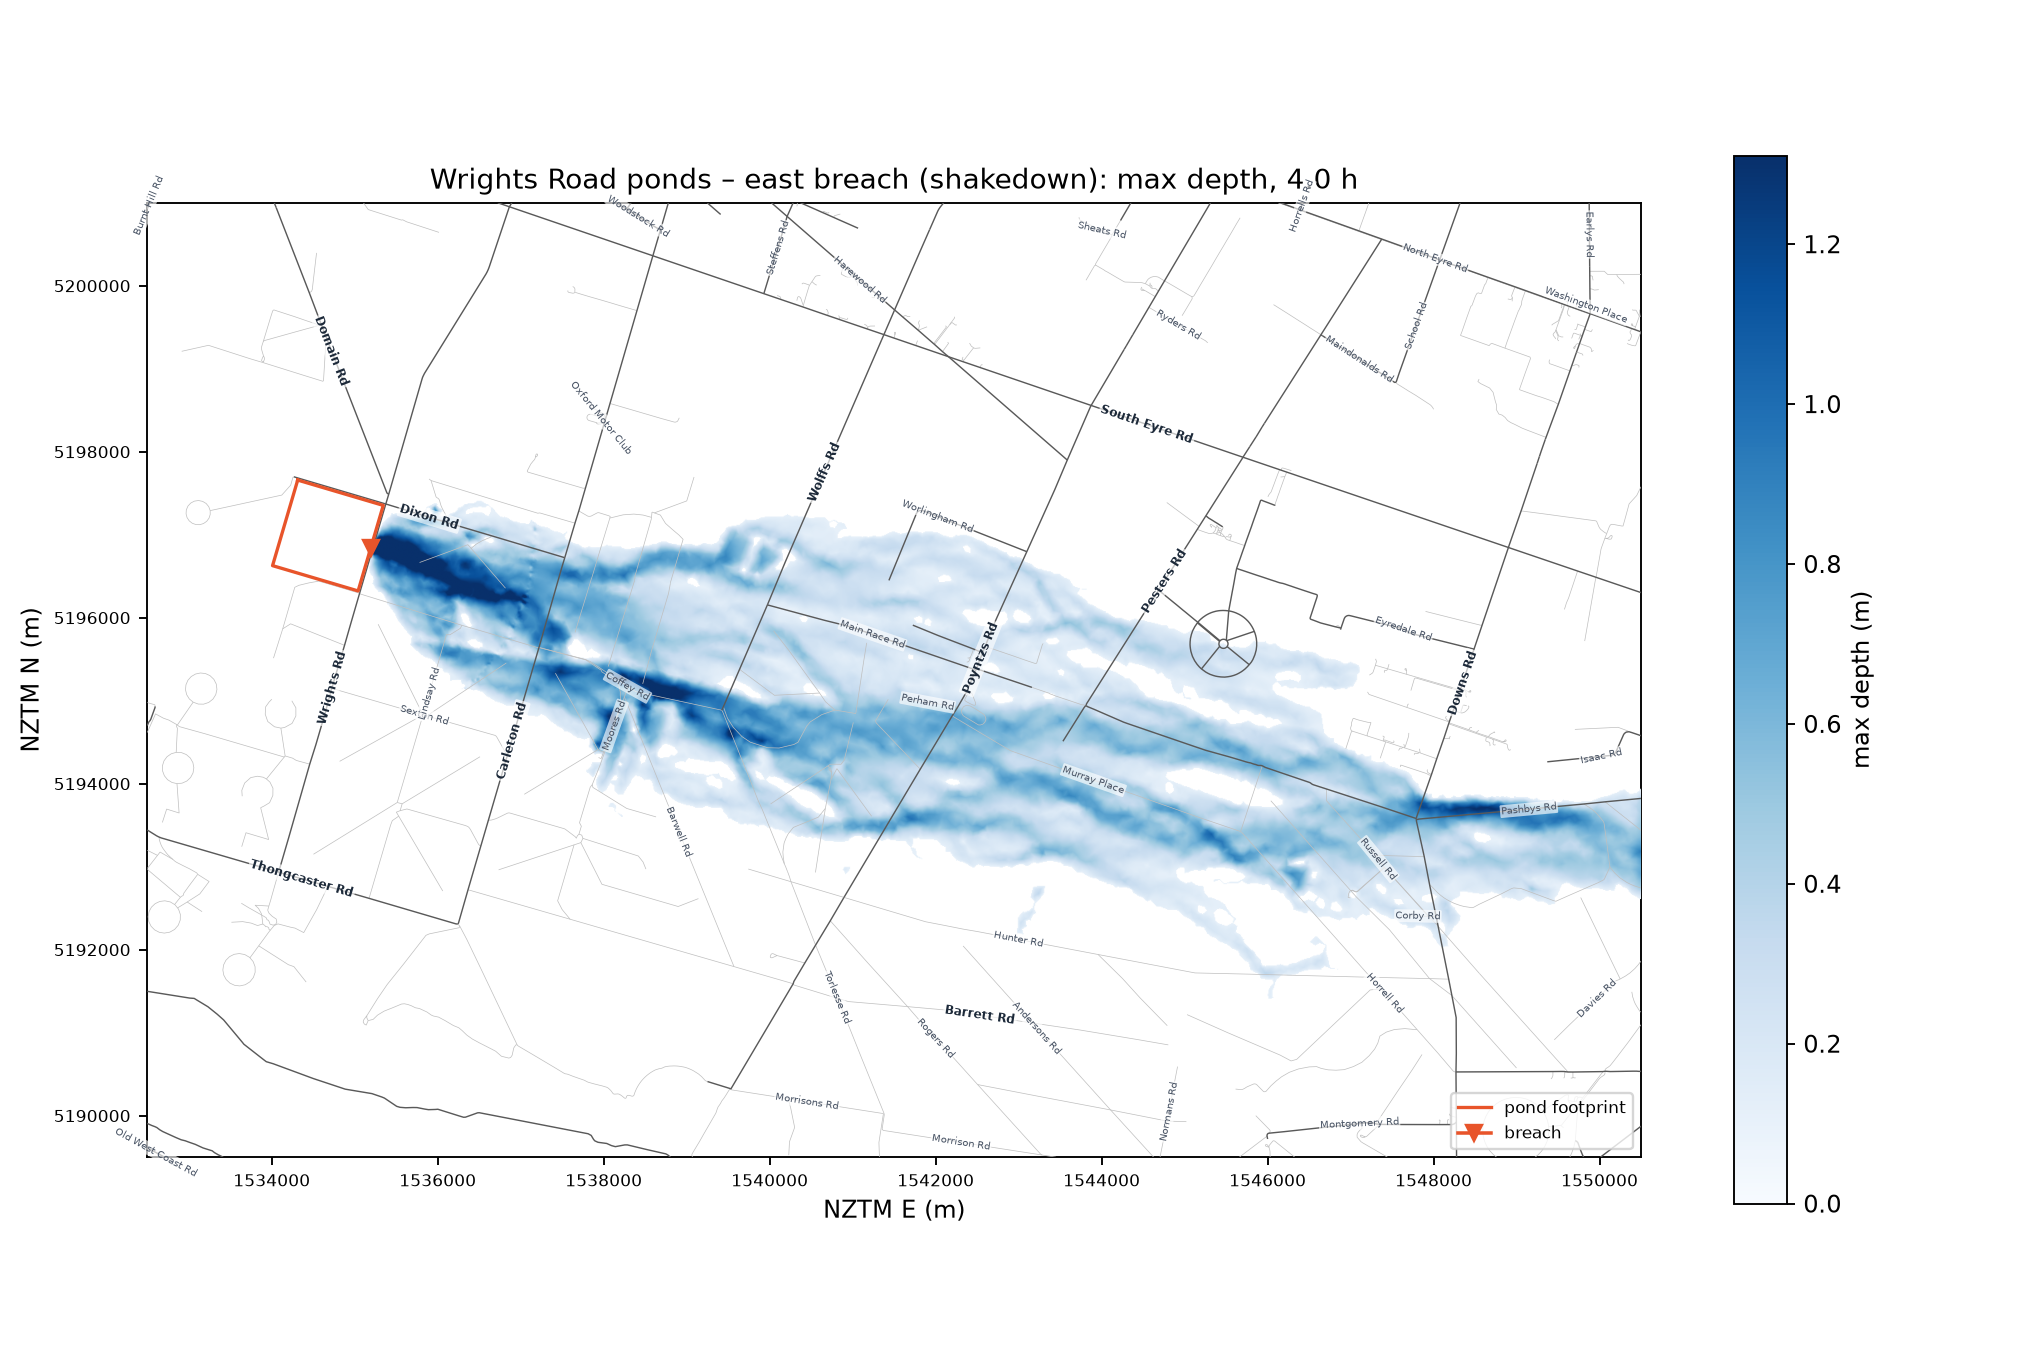
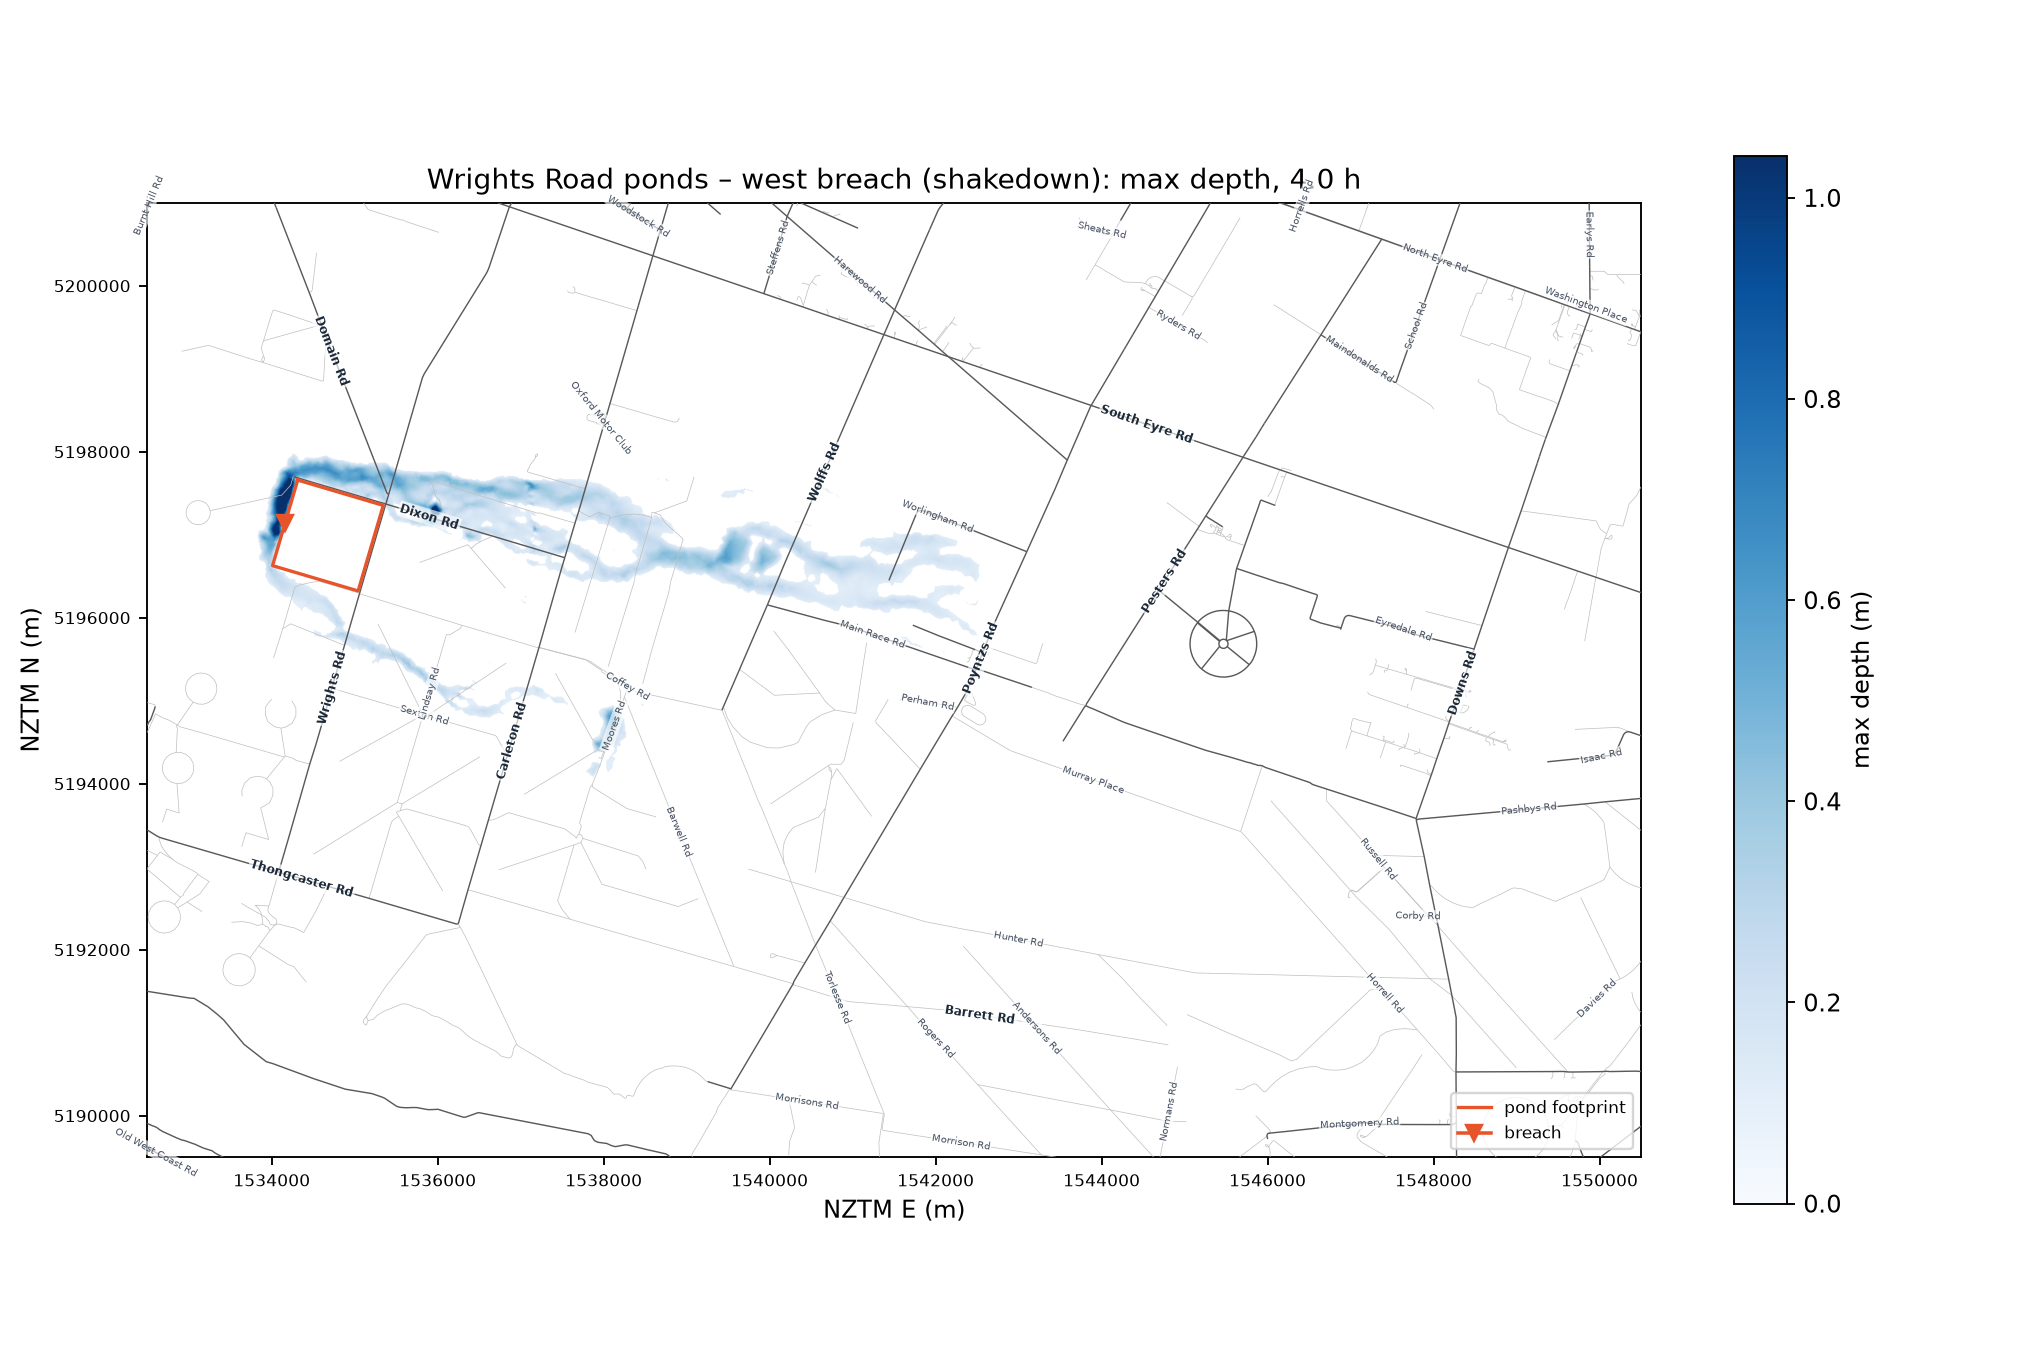
| Inundated area > 0.1 m (km²) | 39.47 | 5.99 | flood zone 73 / 15 |
| Deepest water (m) | 2.9 | 1.7 | – |
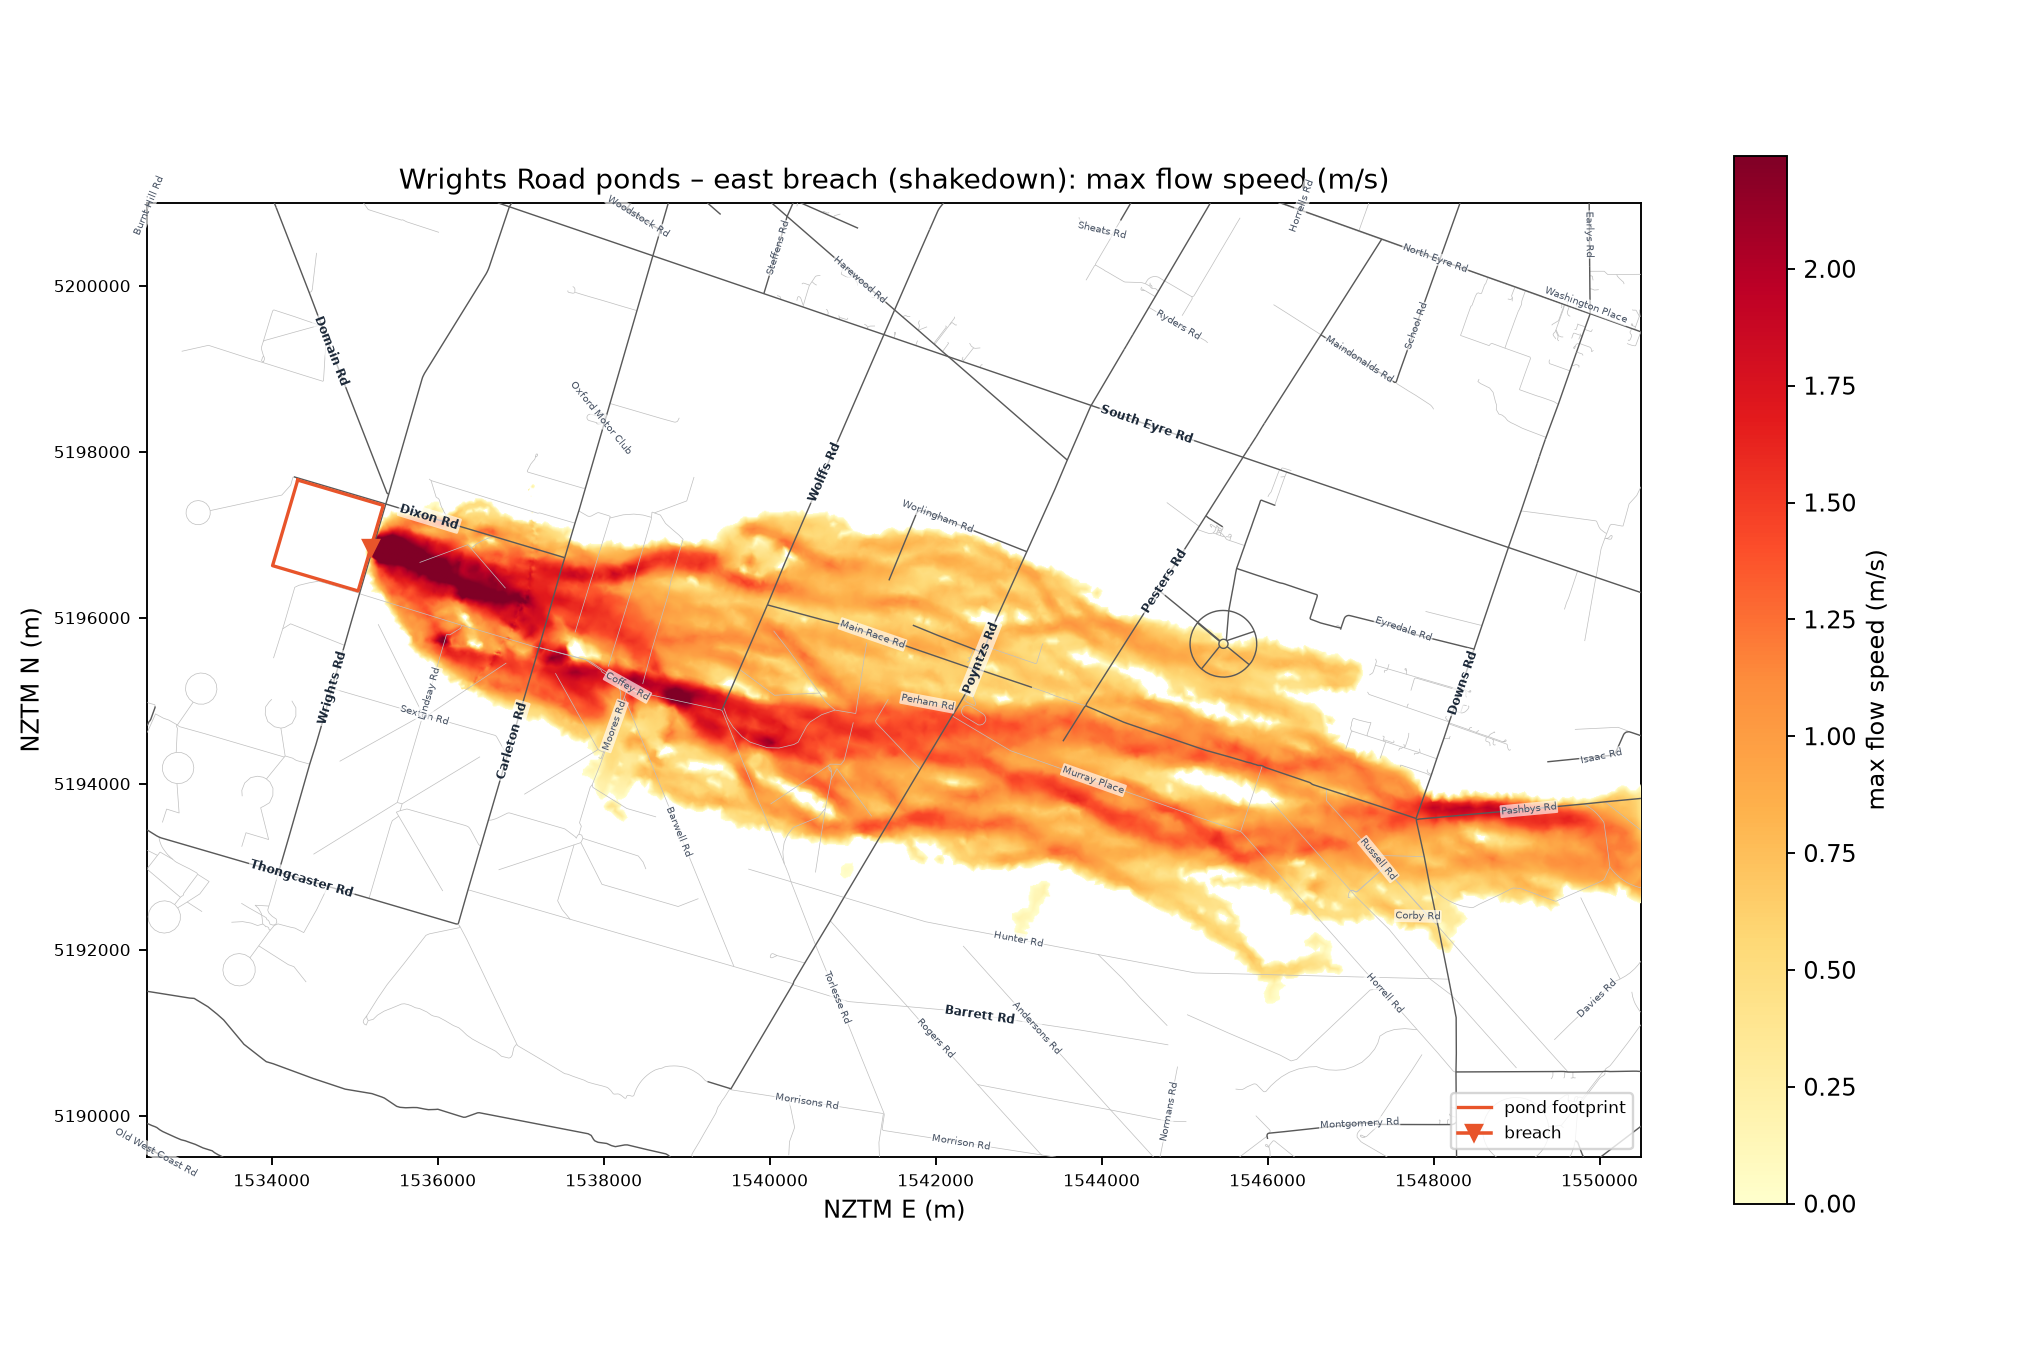
| Fastest flow (m/s) | 5.5 | 1.8 | – |
| Buildings > 0.1 m / ≥ 0.5 m | 439 / 95 | 45 / 2 | households in zone 176 / at risk 40 ; 50 / 1 |
| PAR screening (2.5 persons per at-risk building) | 238 | 5 | 107 / 4 |
| Road | Damwatch arrival (h) | Model arrival (h) | Damwatch depth (m) | Model max depth (m) |
|---|---|---|---|---|
| Carleton Road | 1.50 | 0.77 | 0.68 | 1.00 |
| Wolffs Road | 2.08 | 1.33 | 0.33 | 0.94 |
| Poyntzs Road | 2.67 | 1.90 | 0.34 | 0.75 |
| Pesters Road | 3.00 | 2.27 | 0.57 | 0.51 |
| Downs Road | 4.17 | 3.33 | 0.3 | 1.18 |
| Browns Road | 5.25 | not reached in 4 h | 0.58 | 0.00 |
| Two Chain Road | 7.33 | not reached in 4 h | 0.46 | 0.00 |
| Diversion Road | 9.00 | not reached in 4 h | <0.1 | not reached in 4 h |
The model reaches each road ~45 min earlier and generally deeper than the 2016 study – the expected direction for uniform roughness (n = 0.045), a 20 m grid that smooths road/race embankments, and a 1.1 h breach formation. These are the phase-1 calibration levers.
| Road | First arrival (h) | Max depth (m) |
|---|---|---|
| Carleton Road | 1.93 | 0.37 |
| Wolffs Road | 2.86 | 0.30 |
| Wrights Road | 1.13 | 0.57 |
| Dixon Road | 0.64 | 0.71 |
| Domain Road | 1.10 | 0.50 |
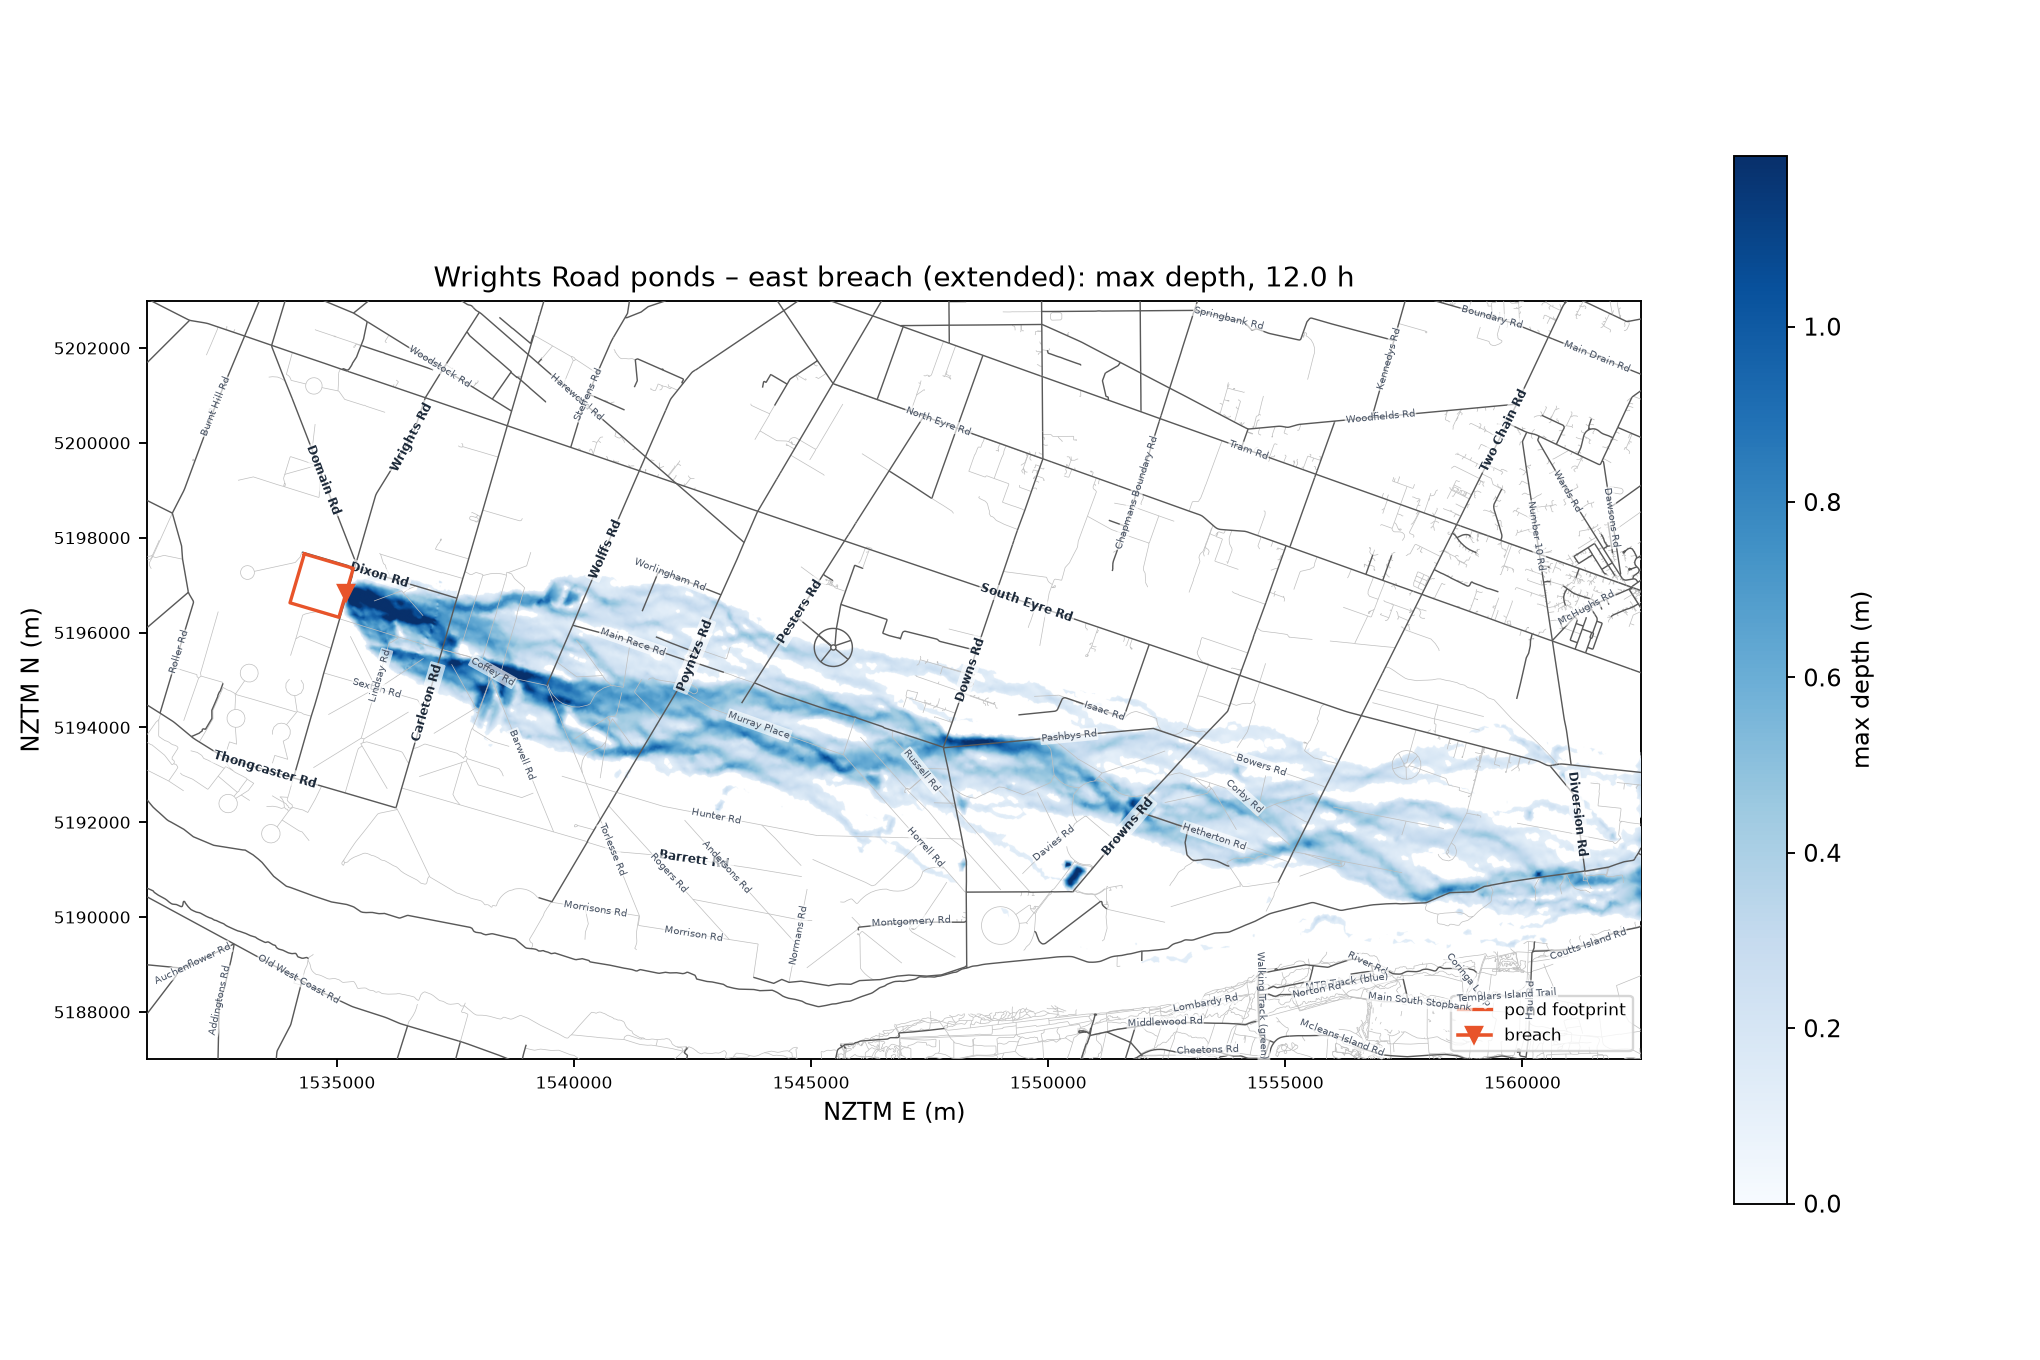
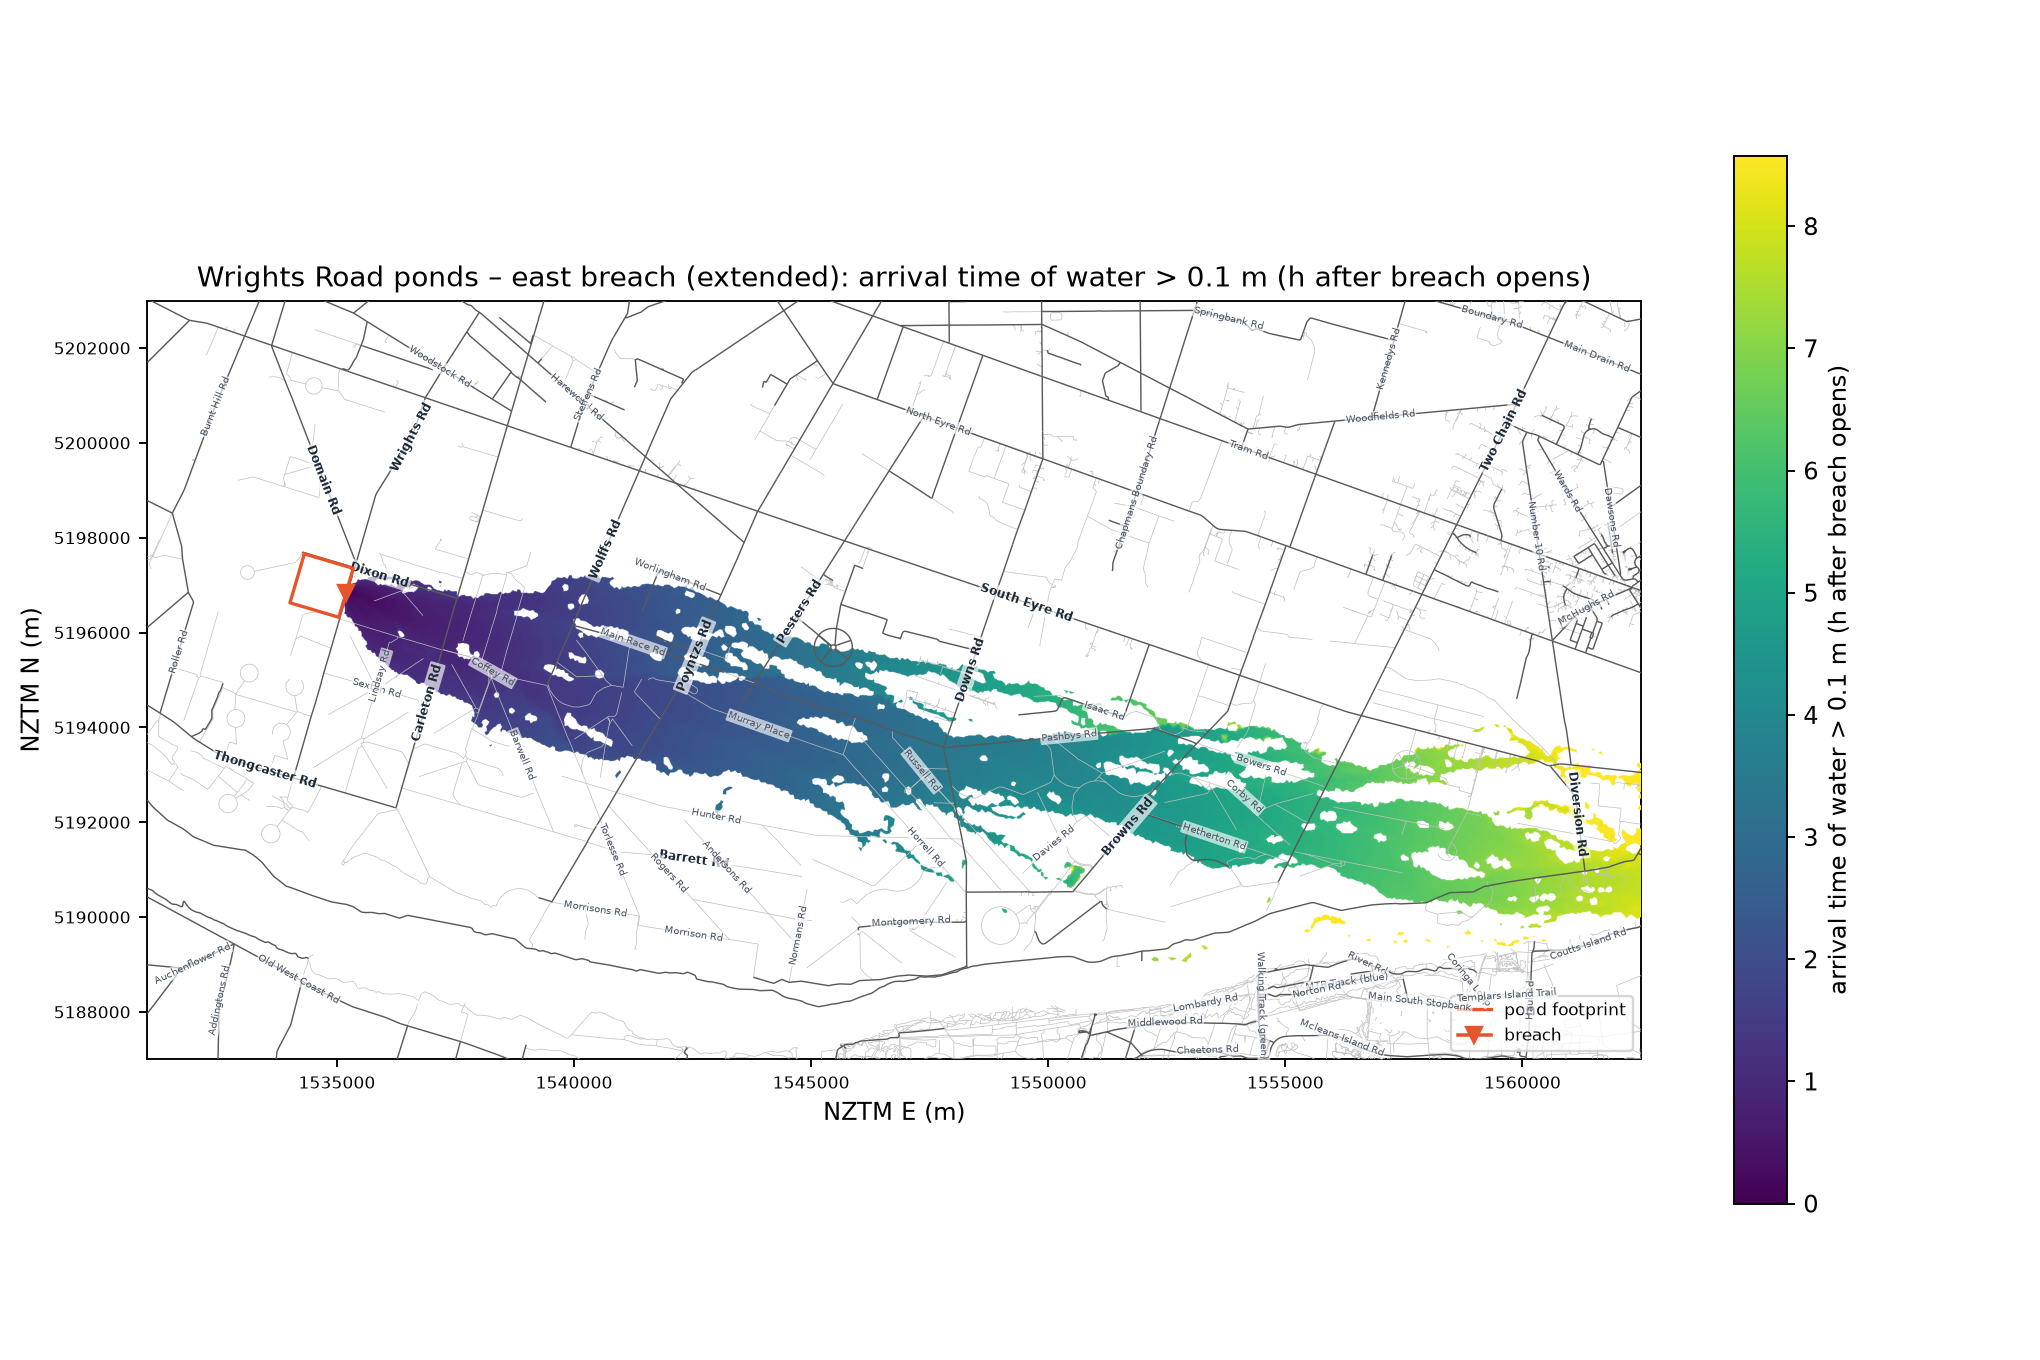
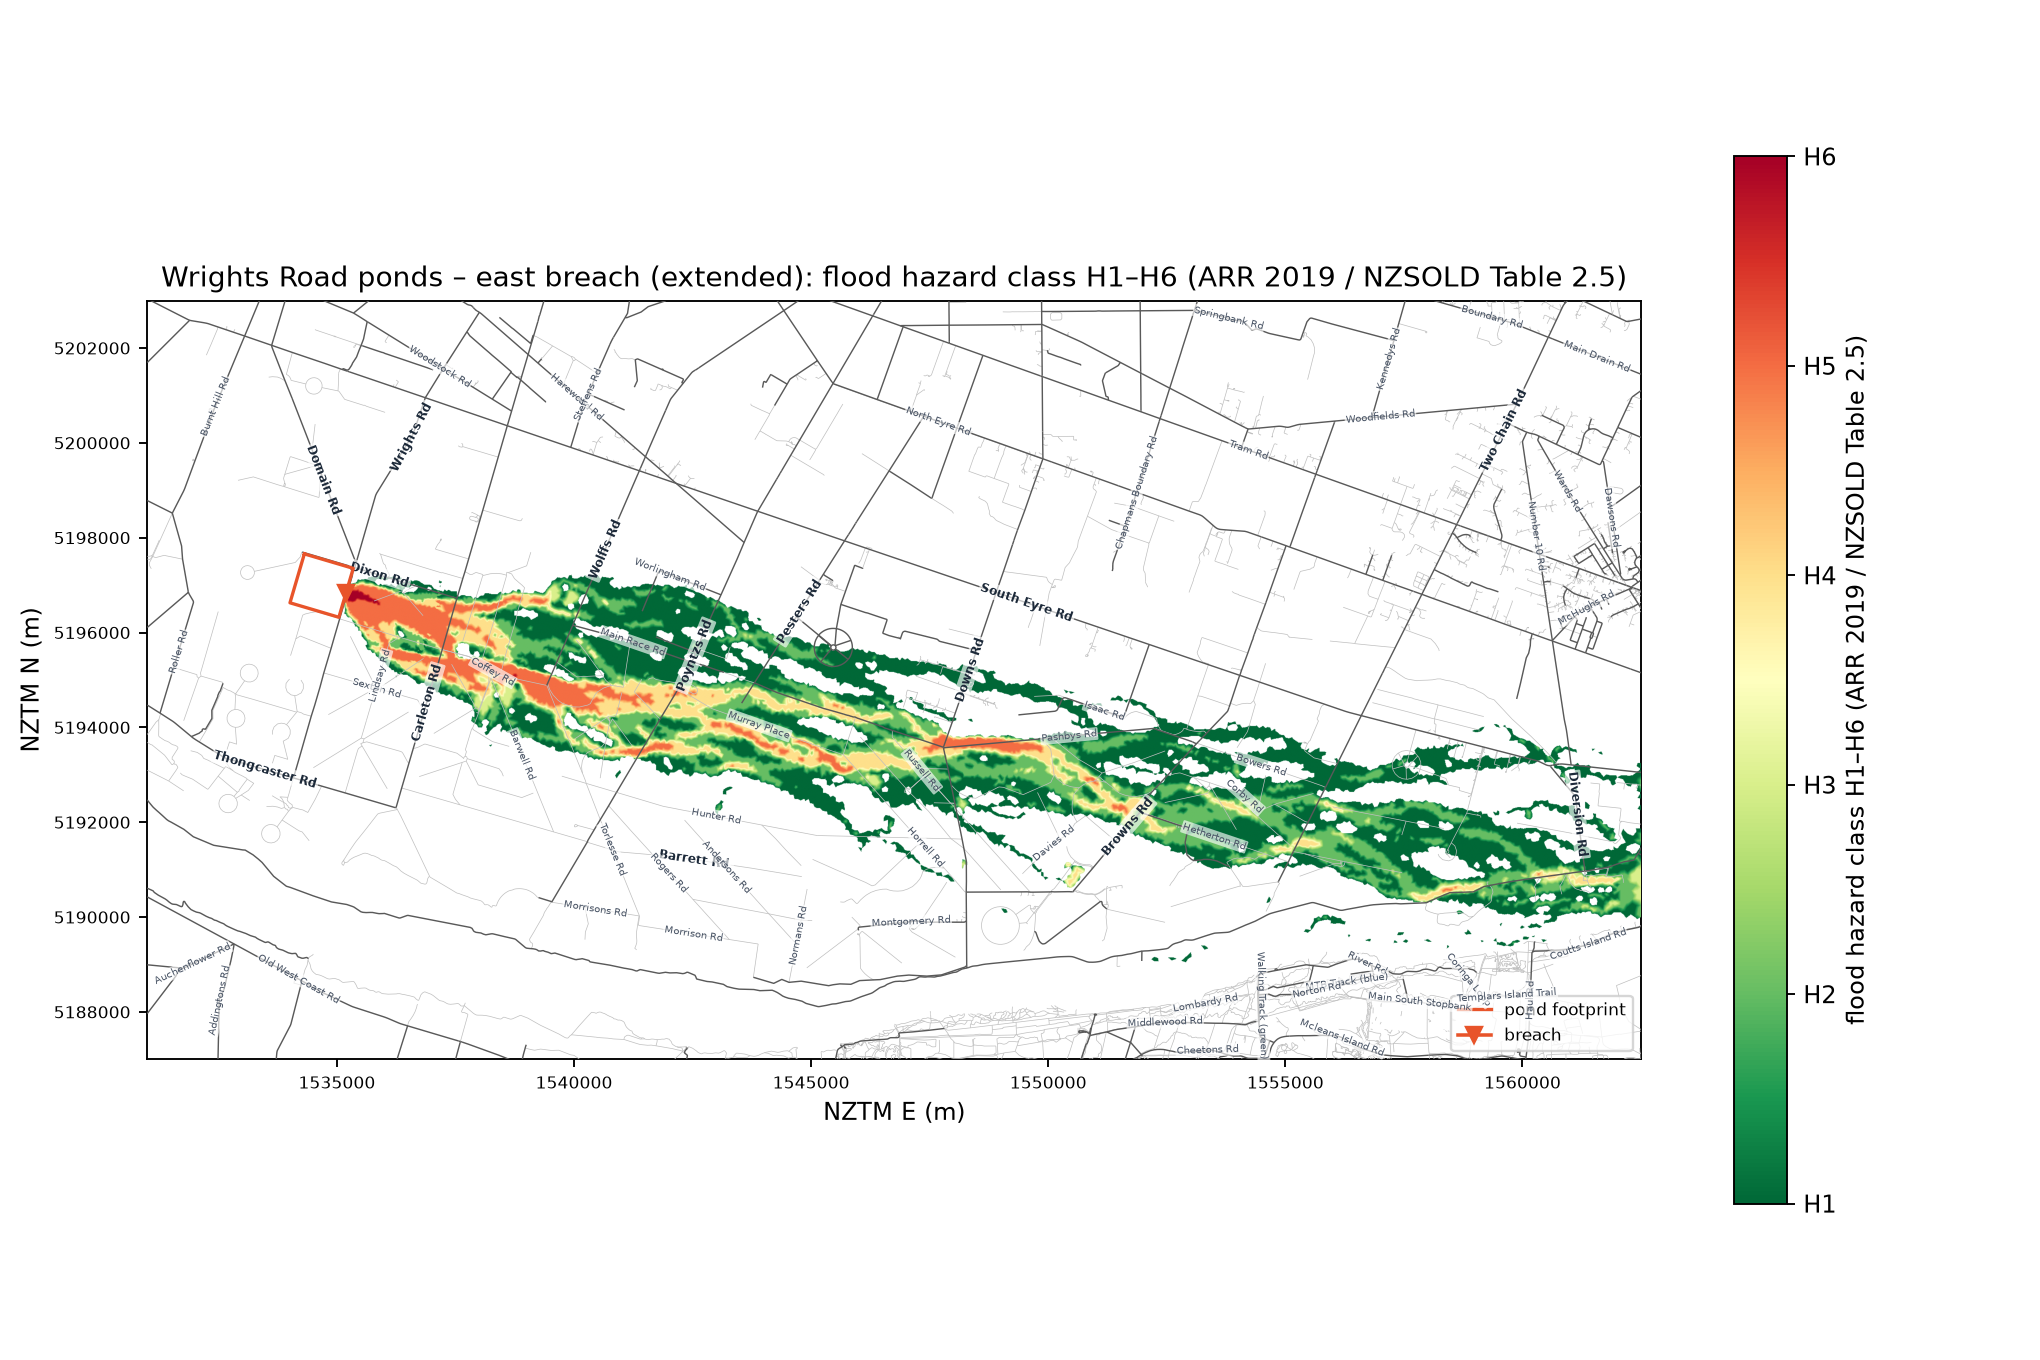
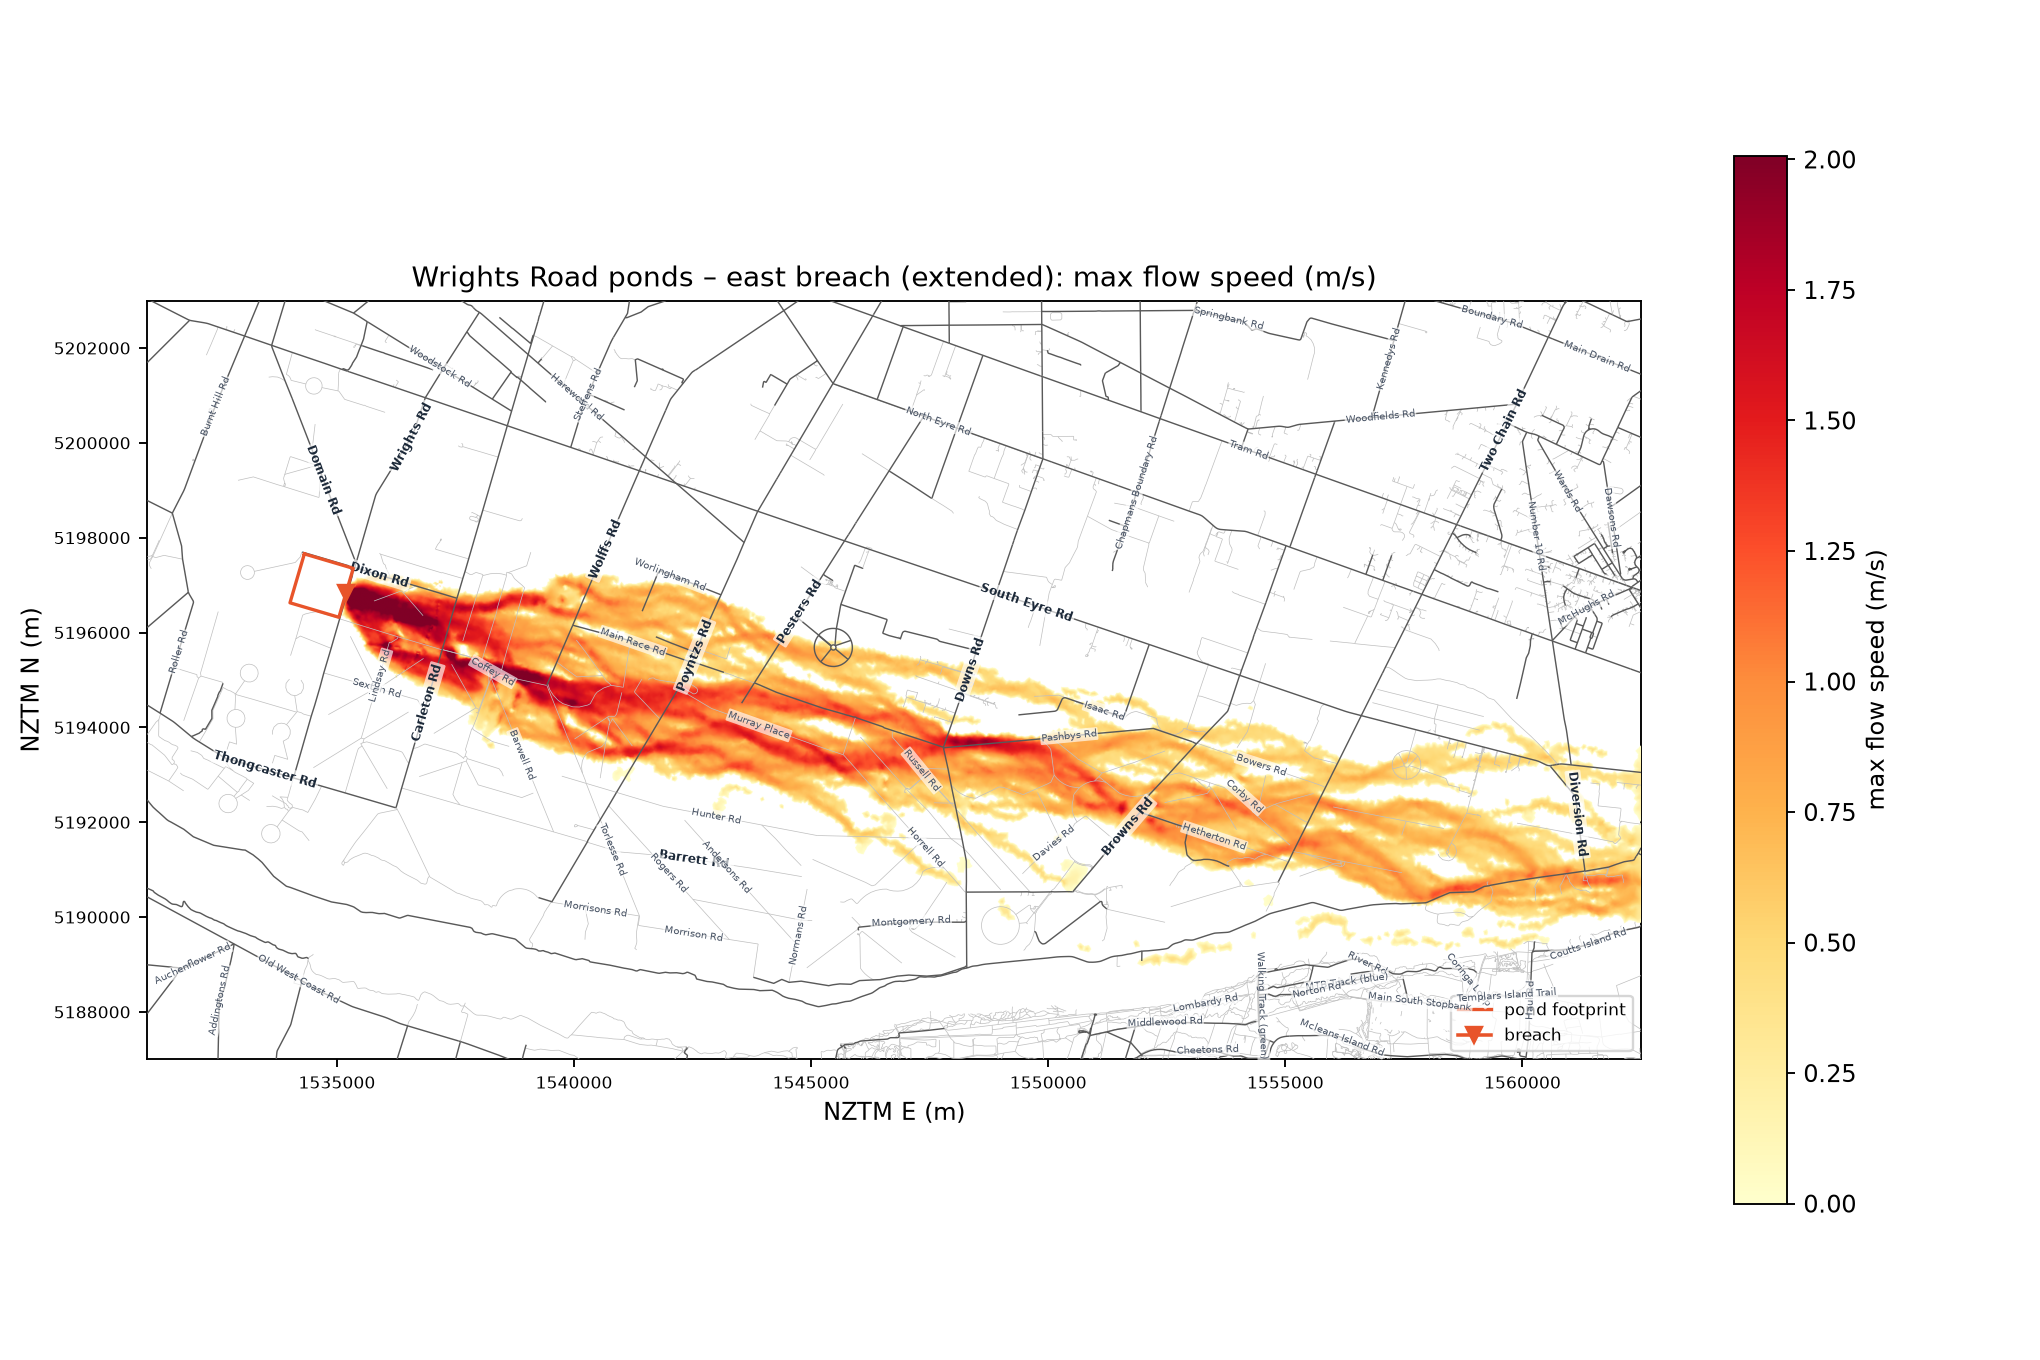
The east cascade breach re-run on the full 31.5 km × 16 km study domain (site to Diversion Road and the
Waimakariri River; the east edge sits 1 km beyond Diversion Road so the open boundary is on the river side of
the road). Same 20 m LiDAR grid, mesh densities, roughness and hydrograph as the shakedown; 272,000 triangles,
12 h simulated (12 h wall-clock on one loaded Apple-silicon core). Outputs: outputs/east/*_extended.*;
animation: docs/east-extended.
| Metric | East, extended (12 h) | East, shakedown (4 h) | Damwatch 2012 |
|---|---|---|---|
| Inundated area > 0.1 m (km²) | 68.9 | 39.5 (domain ended at Browns Rd) | flood zone 73 |
| Deepest water (m) | 2.9 | 2.9 | – |
| Fastest flow (m/s) | 5.8 | 5.5 | – |
| Buildings > 0.1 m / ≥ 0.5 m | 527 / 90 | 439 / 95 | households in zone 176 / at risk 40 |
| PAR screening (2.5 persons per at-risk building) | 225 | 238 | 107 |
| Wet area at 12 h (km²) | 15.8 (draining to the river) | – | – |
| Road | Damwatch arrival (h) | Model arrival (h) | Damwatch depth (m) | Model max depth (m) |
|---|---|---|---|---|
| Carleton Road | 1.50 | 0.83 | 0.68 | 1.06 |
| Wolffs Road | 2.08 | 1.33 | 0.33 | 0.99 |
| Poyntzs Road | 2.67 | 1.92 | 0.34 | 0.92 |
| Pesters Road | 3.00 | 2.27 | 0.57 | 0.53 |
| Downs Road | 4.17 | 3.33 | 0.3 | 1.12 |
| Browns Road | 5.25 | 4.34 | 0.58 | 0.64 |
| Two Chain Road | 7.33 | 5.42 | 0.46 | 0.63 |
| Diversion Road | 9.00 | 7.51 | <0.1 | 0.43 |
| South Eyre Road (east end, near Diversion Rd) | – | 7.90 | – | 0.23 |
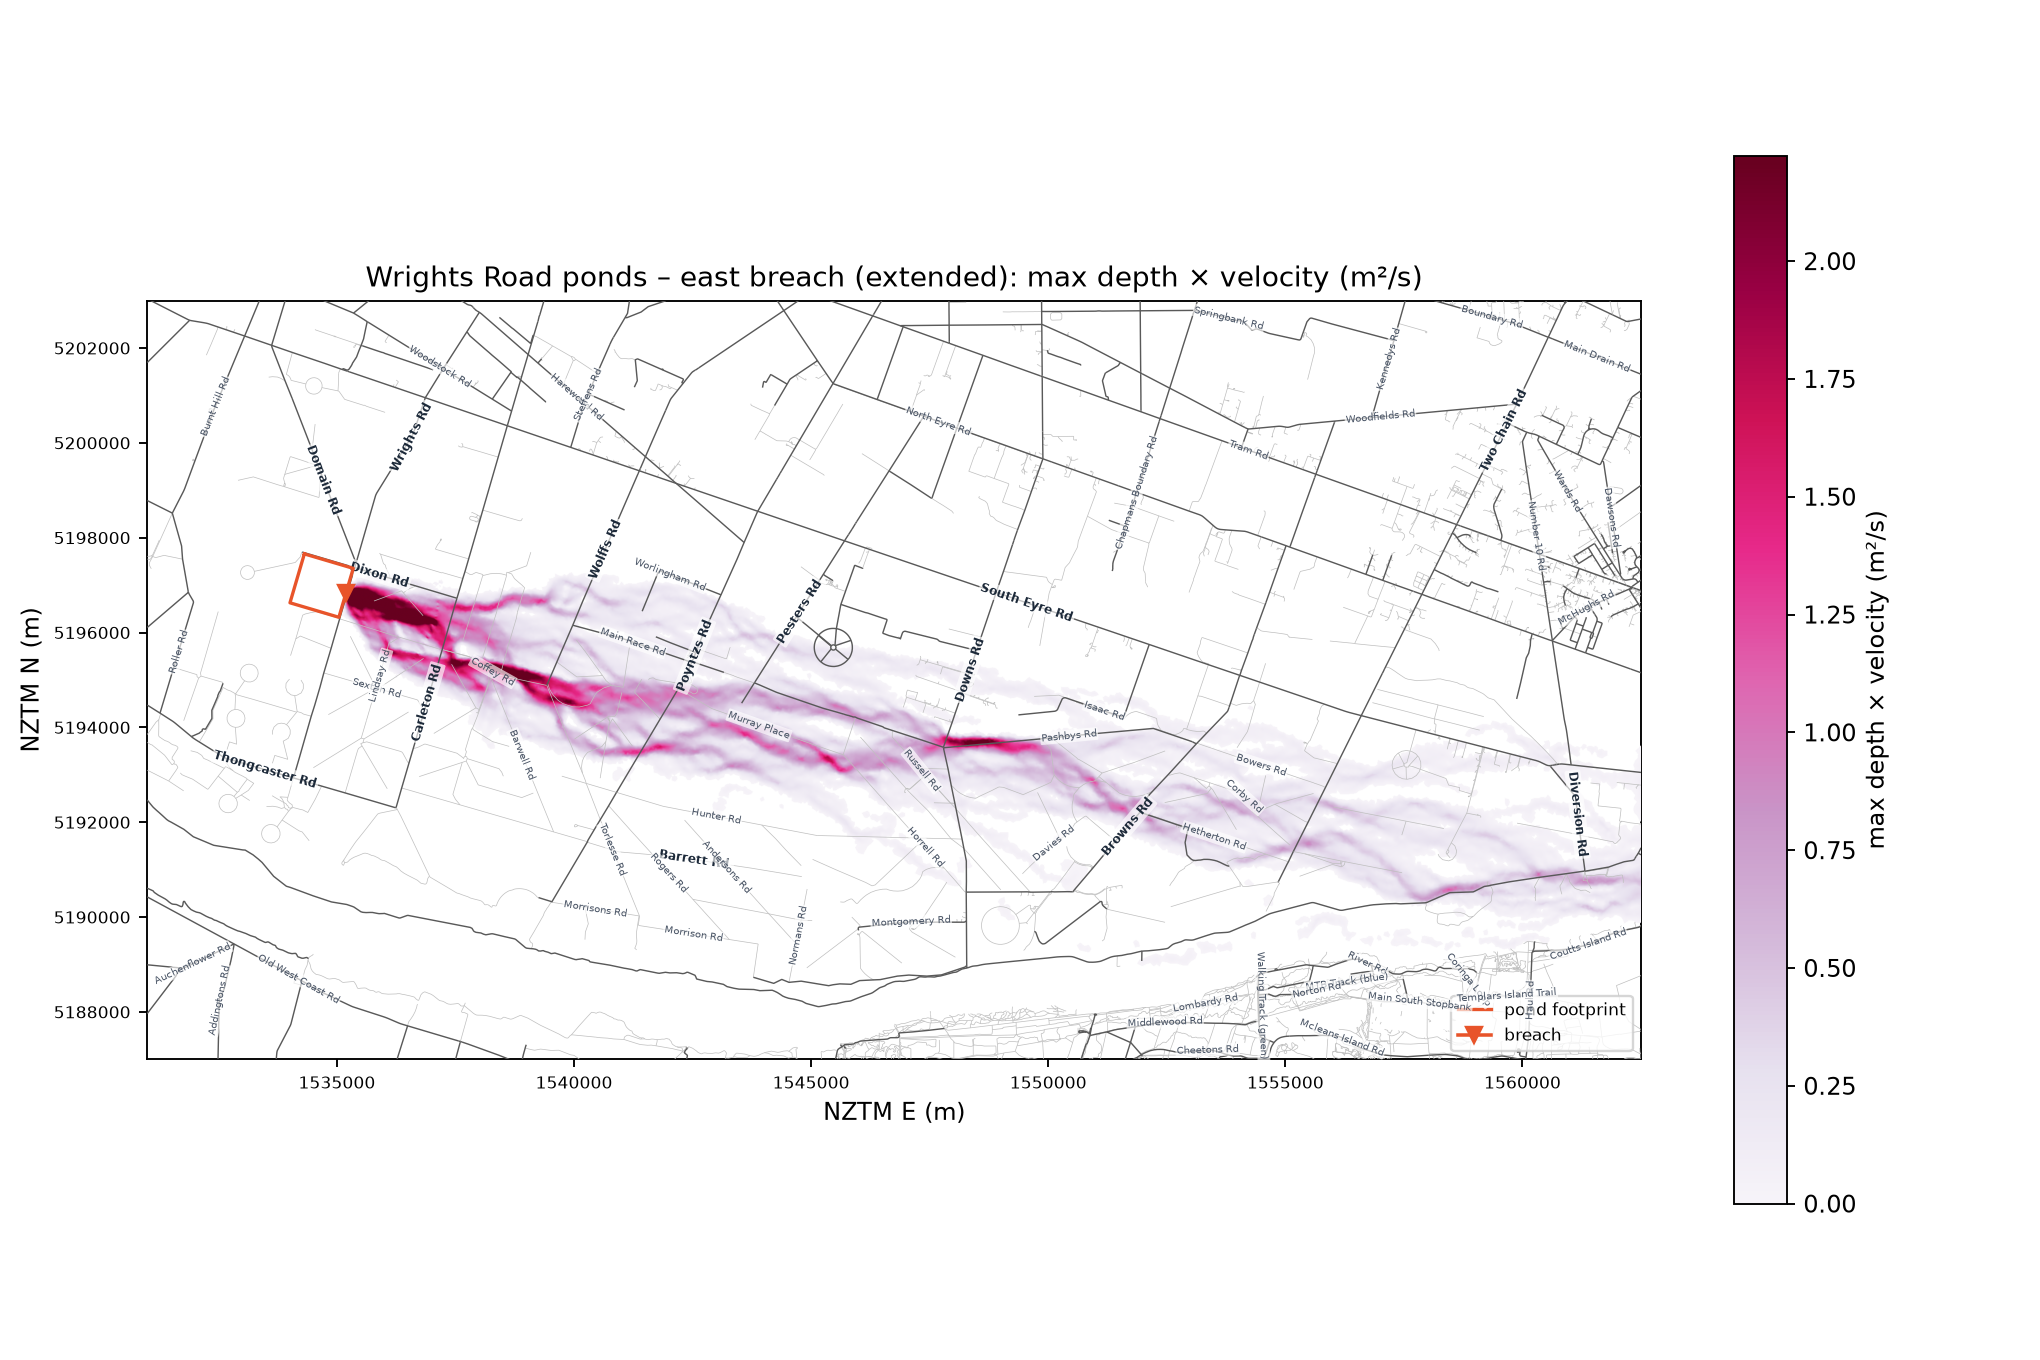
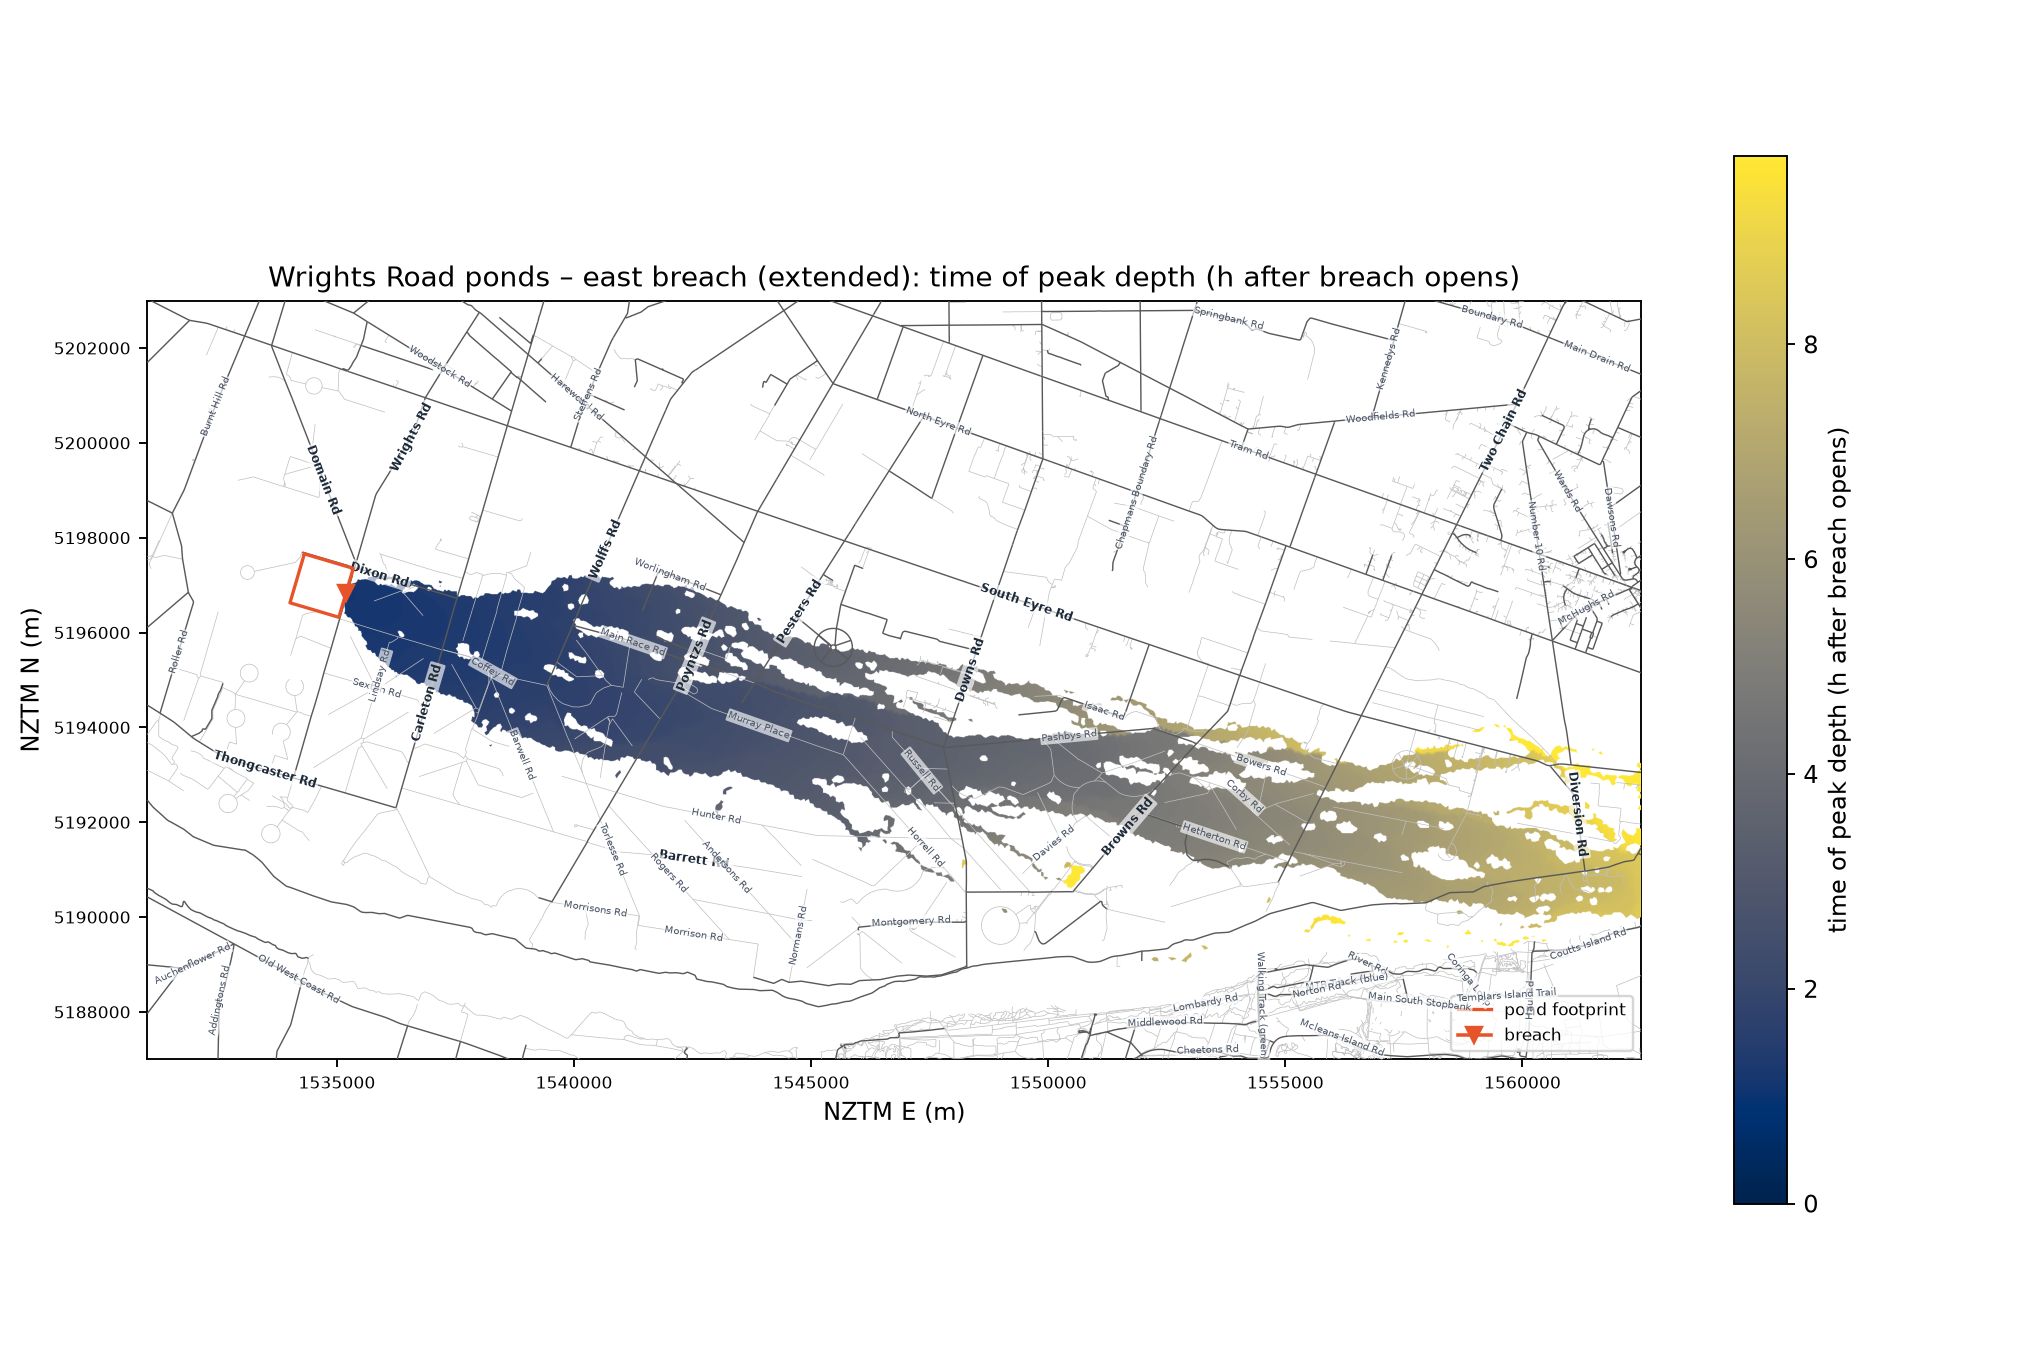
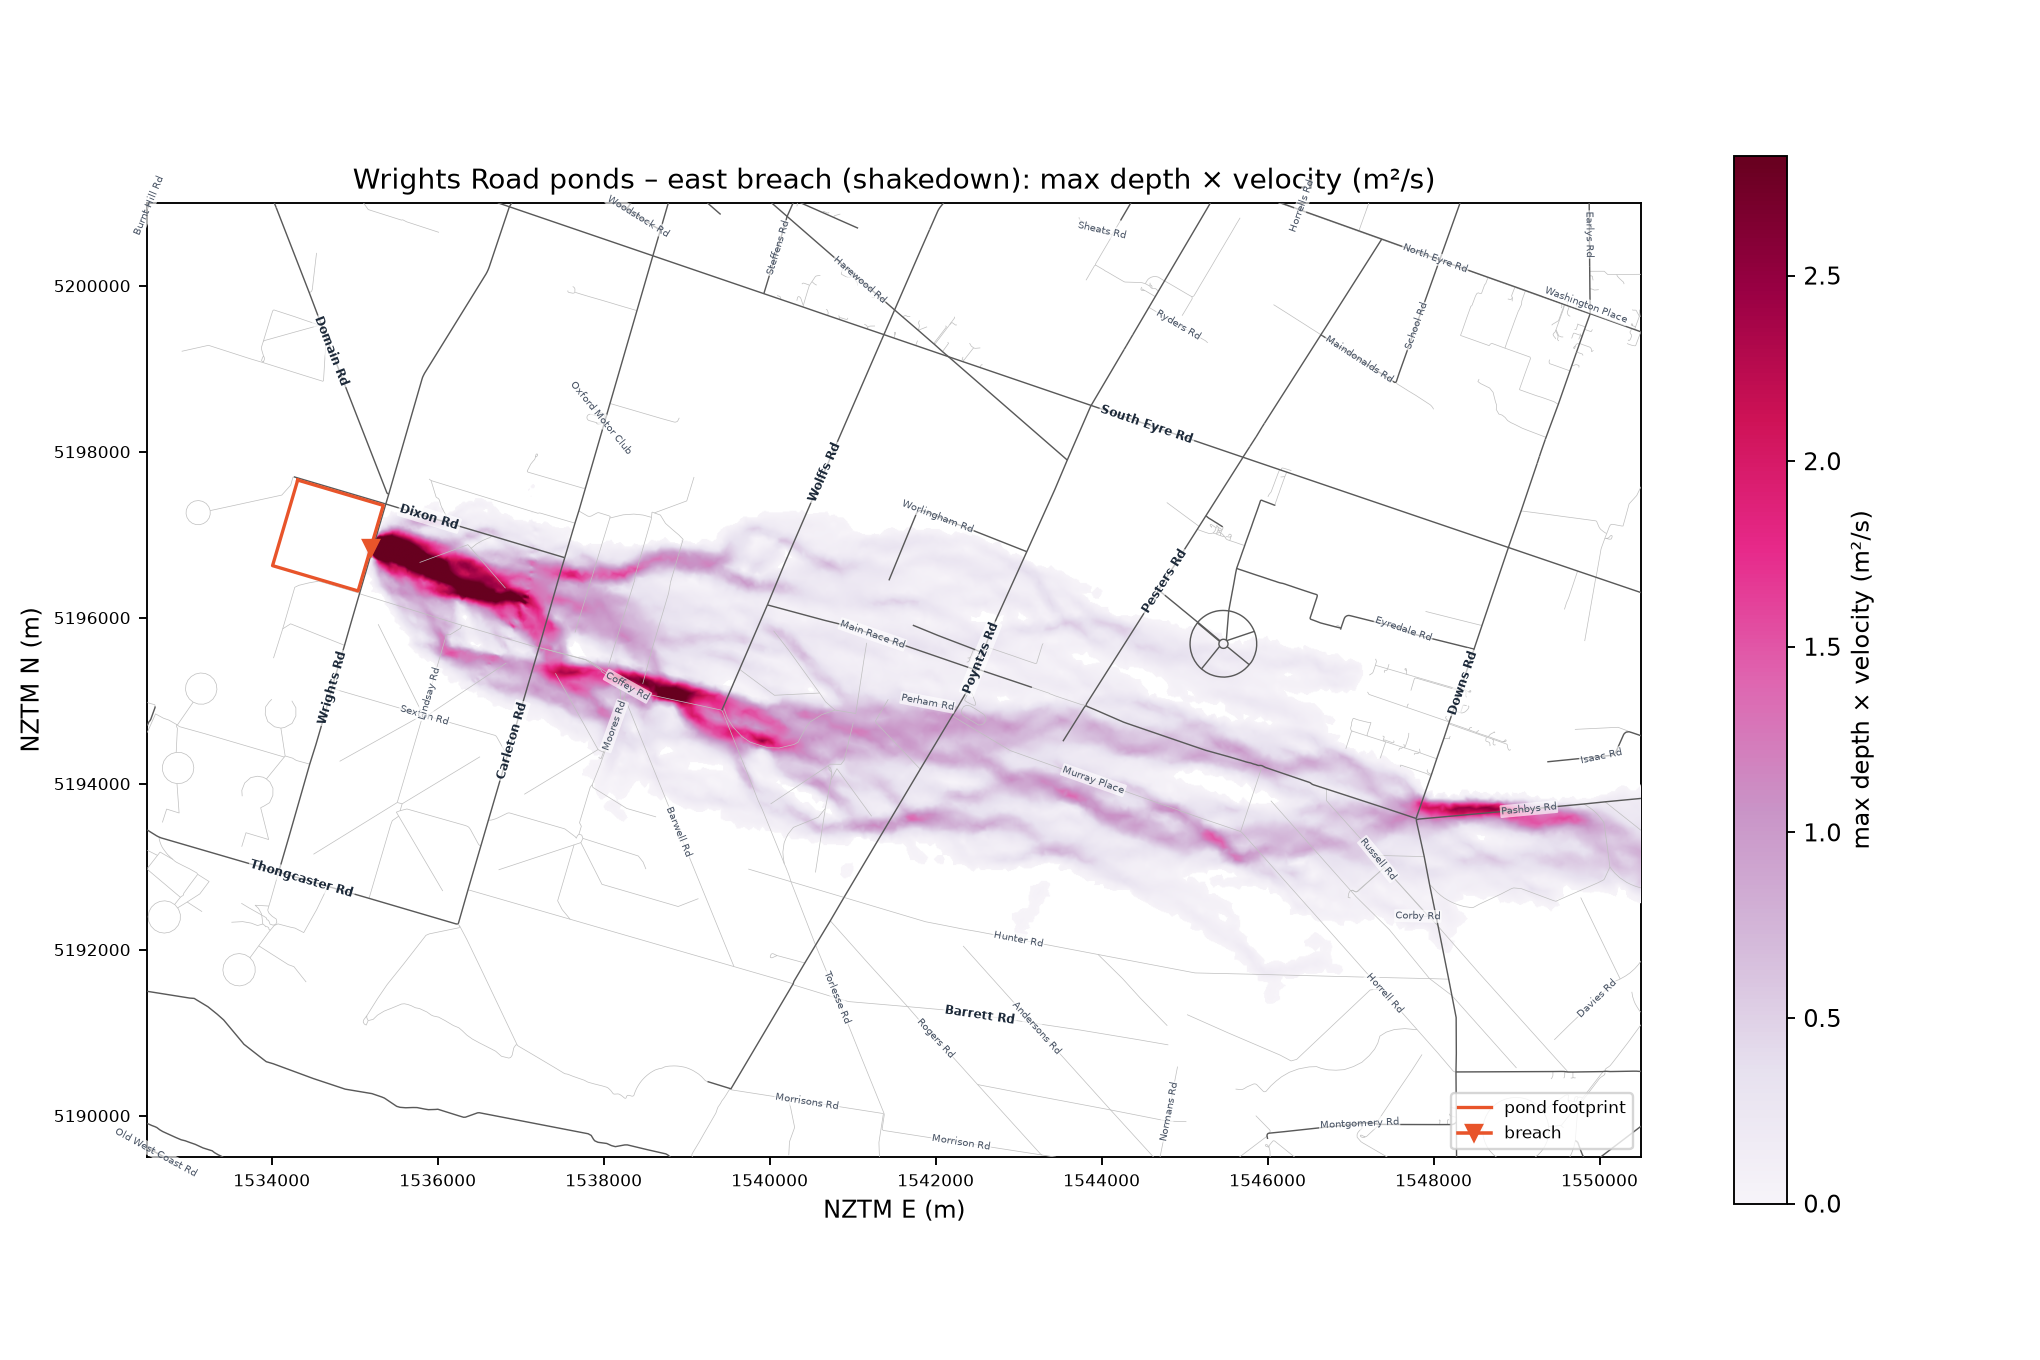
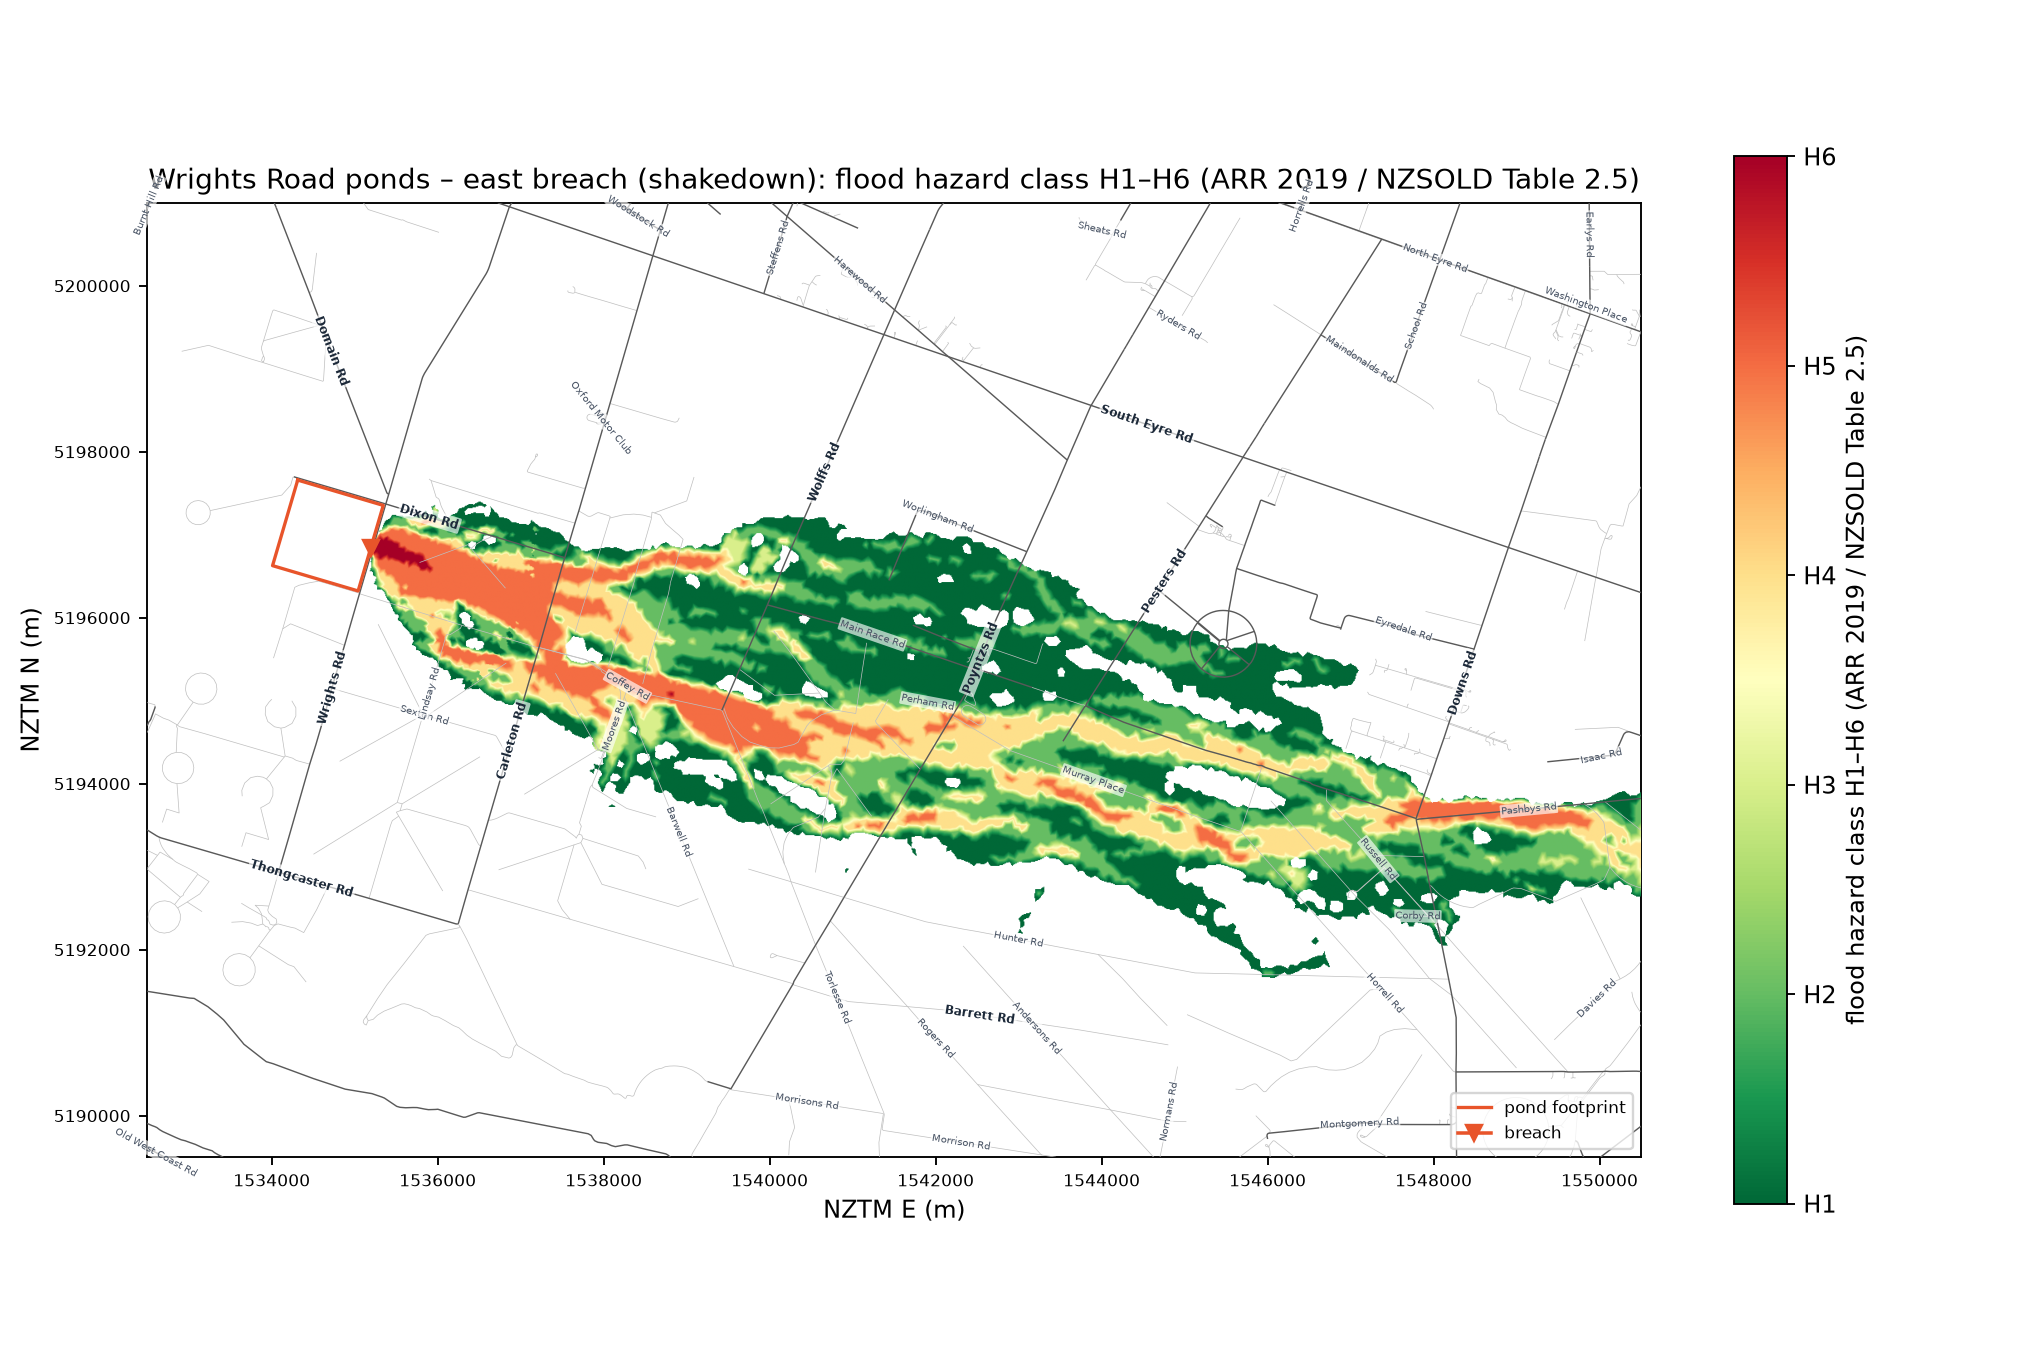
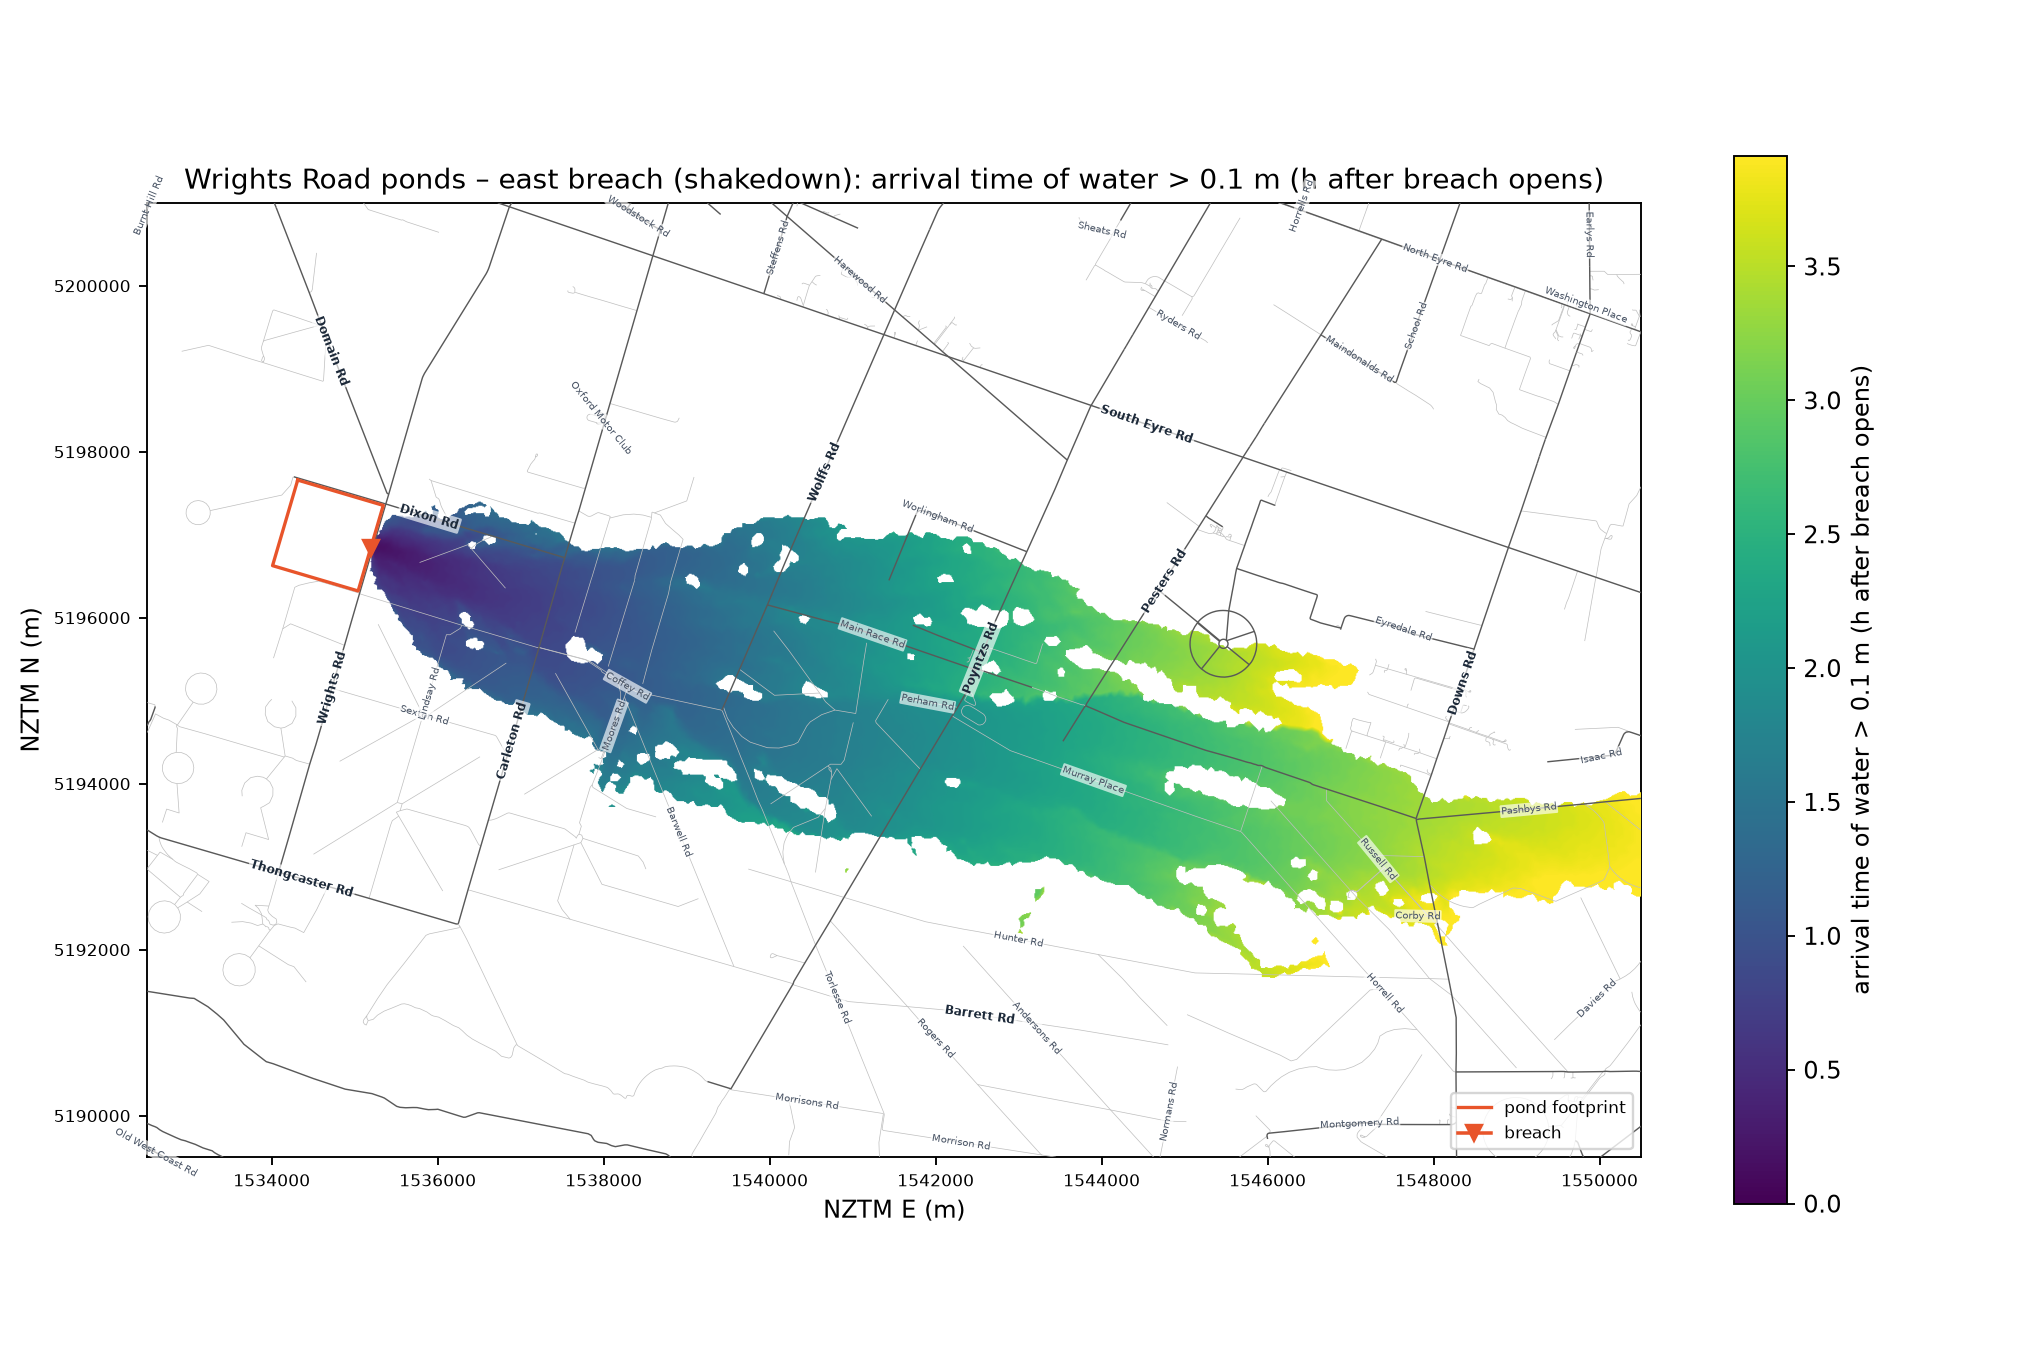
Reading: the full-length wave stays in the Damwatch corridor (between South Eyre Road and the Waimakariri terrace, along the WIL Main Race embankment) all the way to Diversion Road, and the inundated area (69 km²) matches the Damwatch flood zone (73 km²) closely. Arrival is ~1 h earlier at Browns and Two Chain Roads and ~1.5 h earlier at Diversion Road, the same "faster and deeper" bias as the near-field roads (uniform n = 0.045, 20 m grid smoothing embankments and drains, 1.1 h breach formation). The largest difference is at Diversion Road itself: 0.43 m here versus "<0.1 m" in 2016. At that point the model is at the far end of a 26 km routing on a 20 m grid with no drains, culverts or stopbank detail, and the water then leaves through the open east boundary; treat the Diversion Road depth as an upper-bound screening value and the arrival time as ±1 h. The near-field rows change by ≤ 0.06 h / ≤ 0.2 m compared with the shakedown domain, confirming the smaller domain did not bias the earlier results. All 12 roads west of Diversion Road that Damwatch lists are now reached; Thongcaster, Domain and Barrett Roads (south-west of the site) stay dry in the east scenario.
Maximum depth
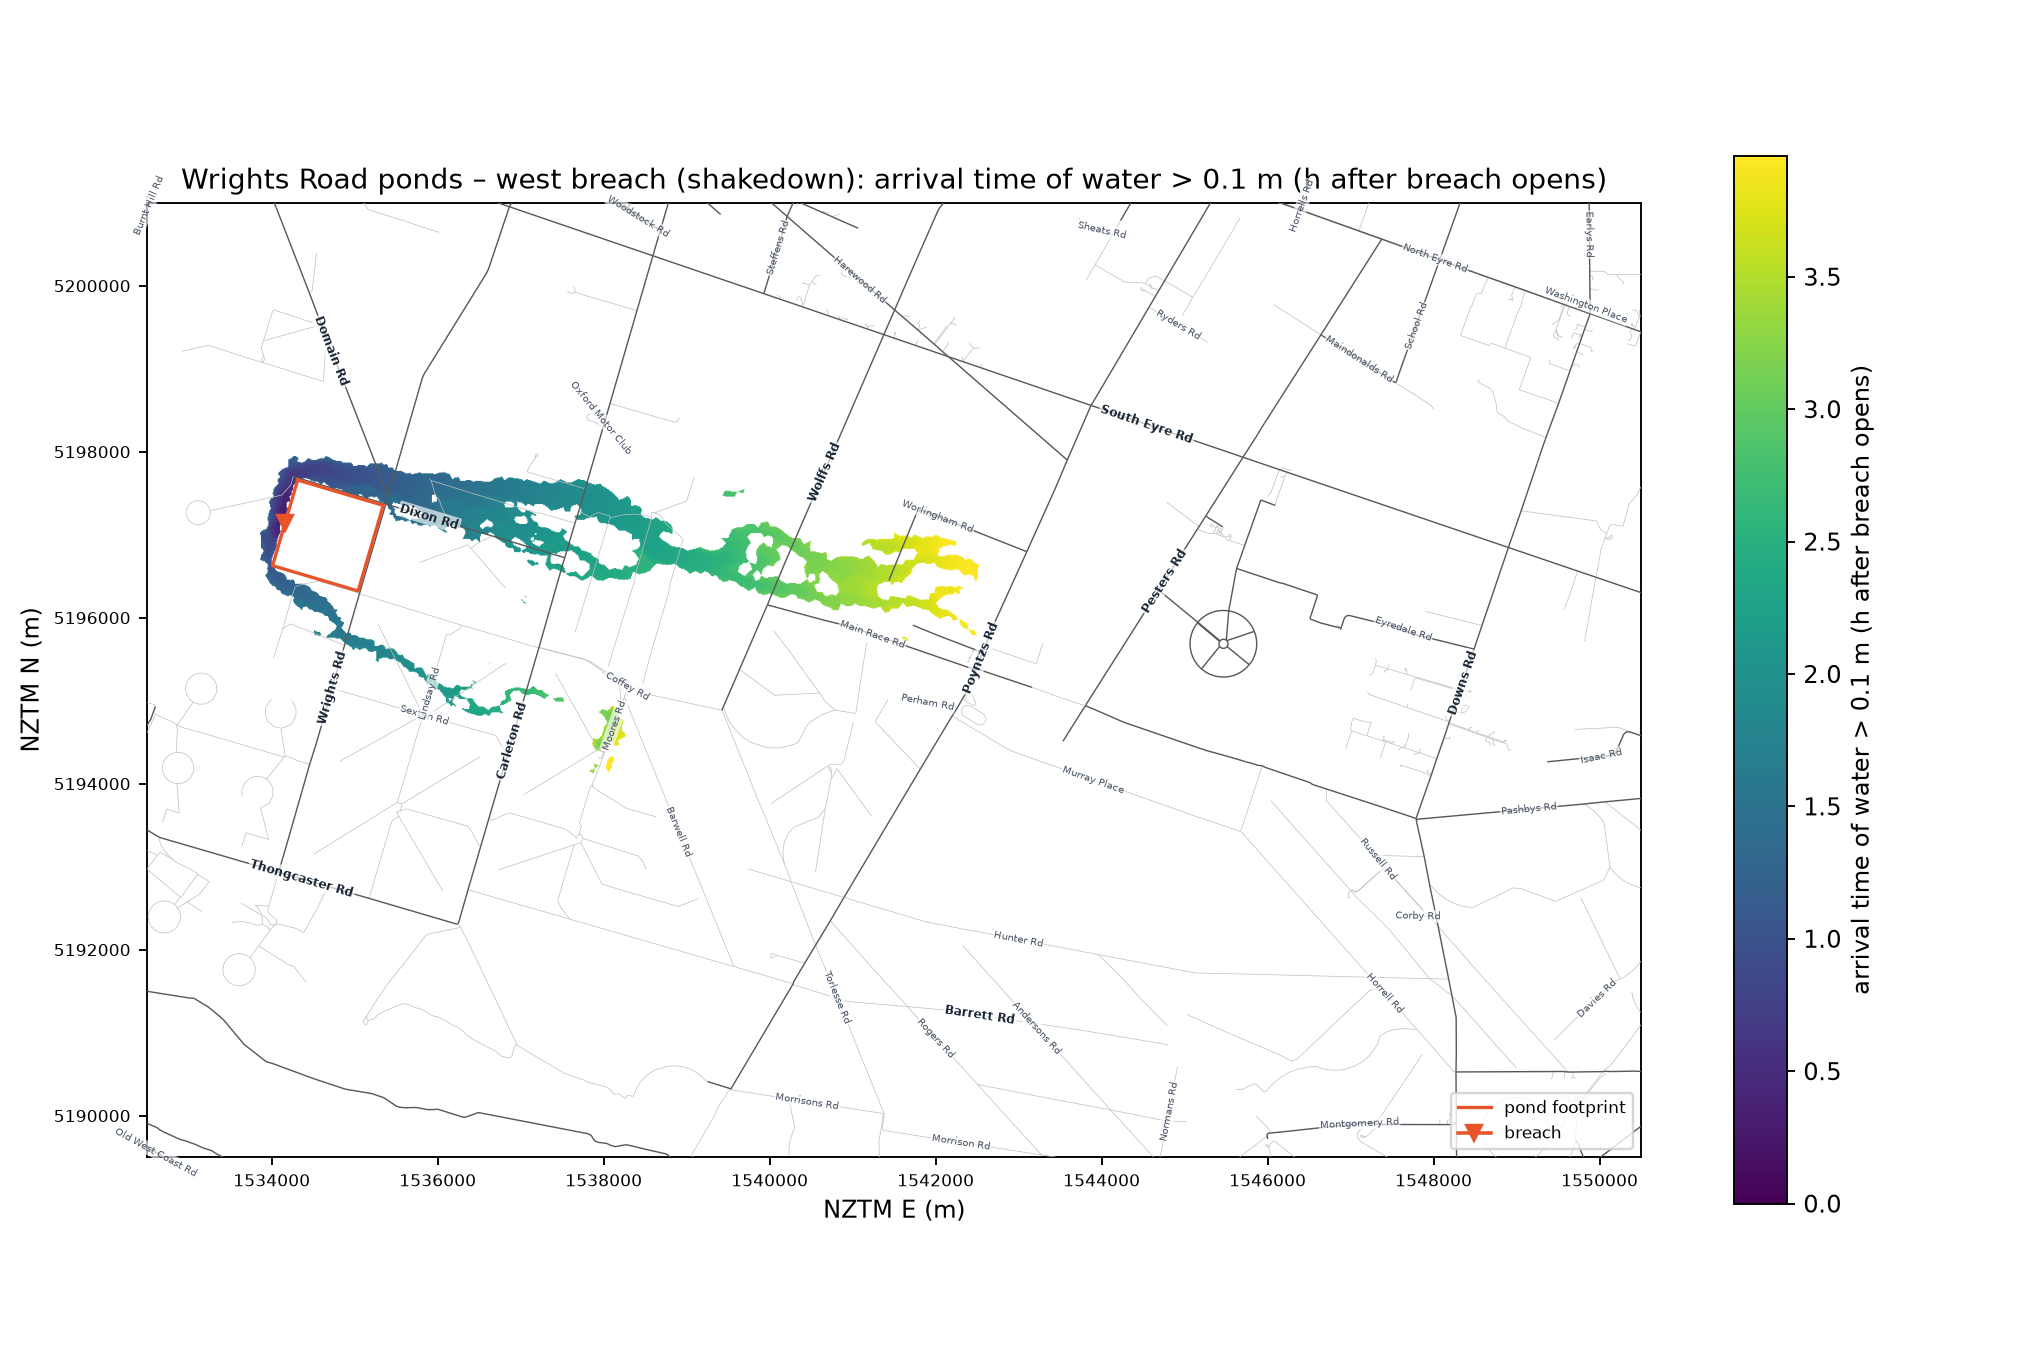
Arrival time
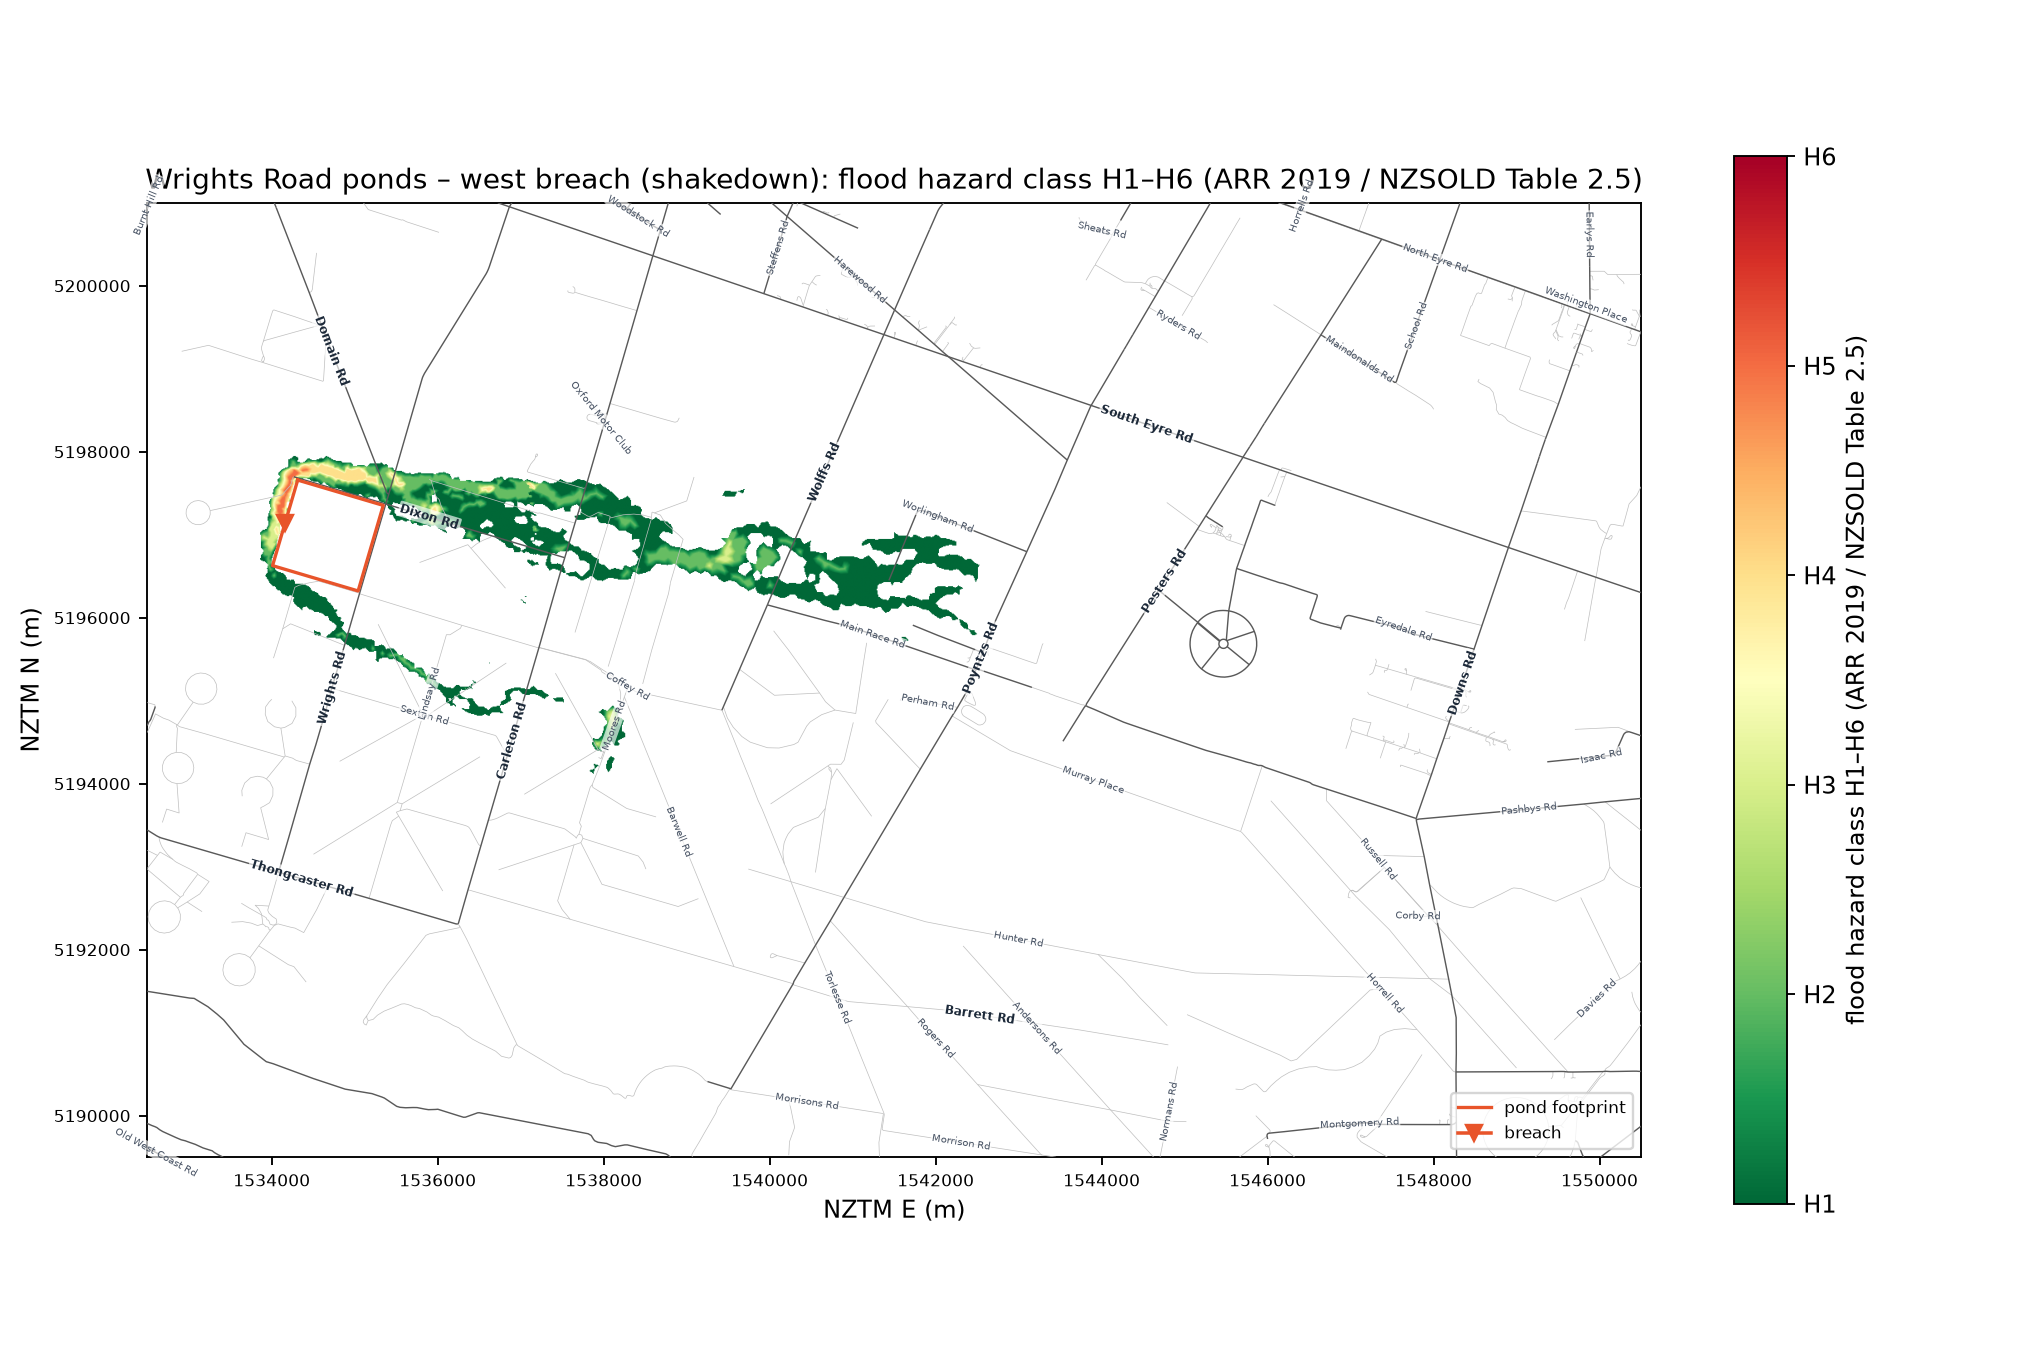
Hazard class
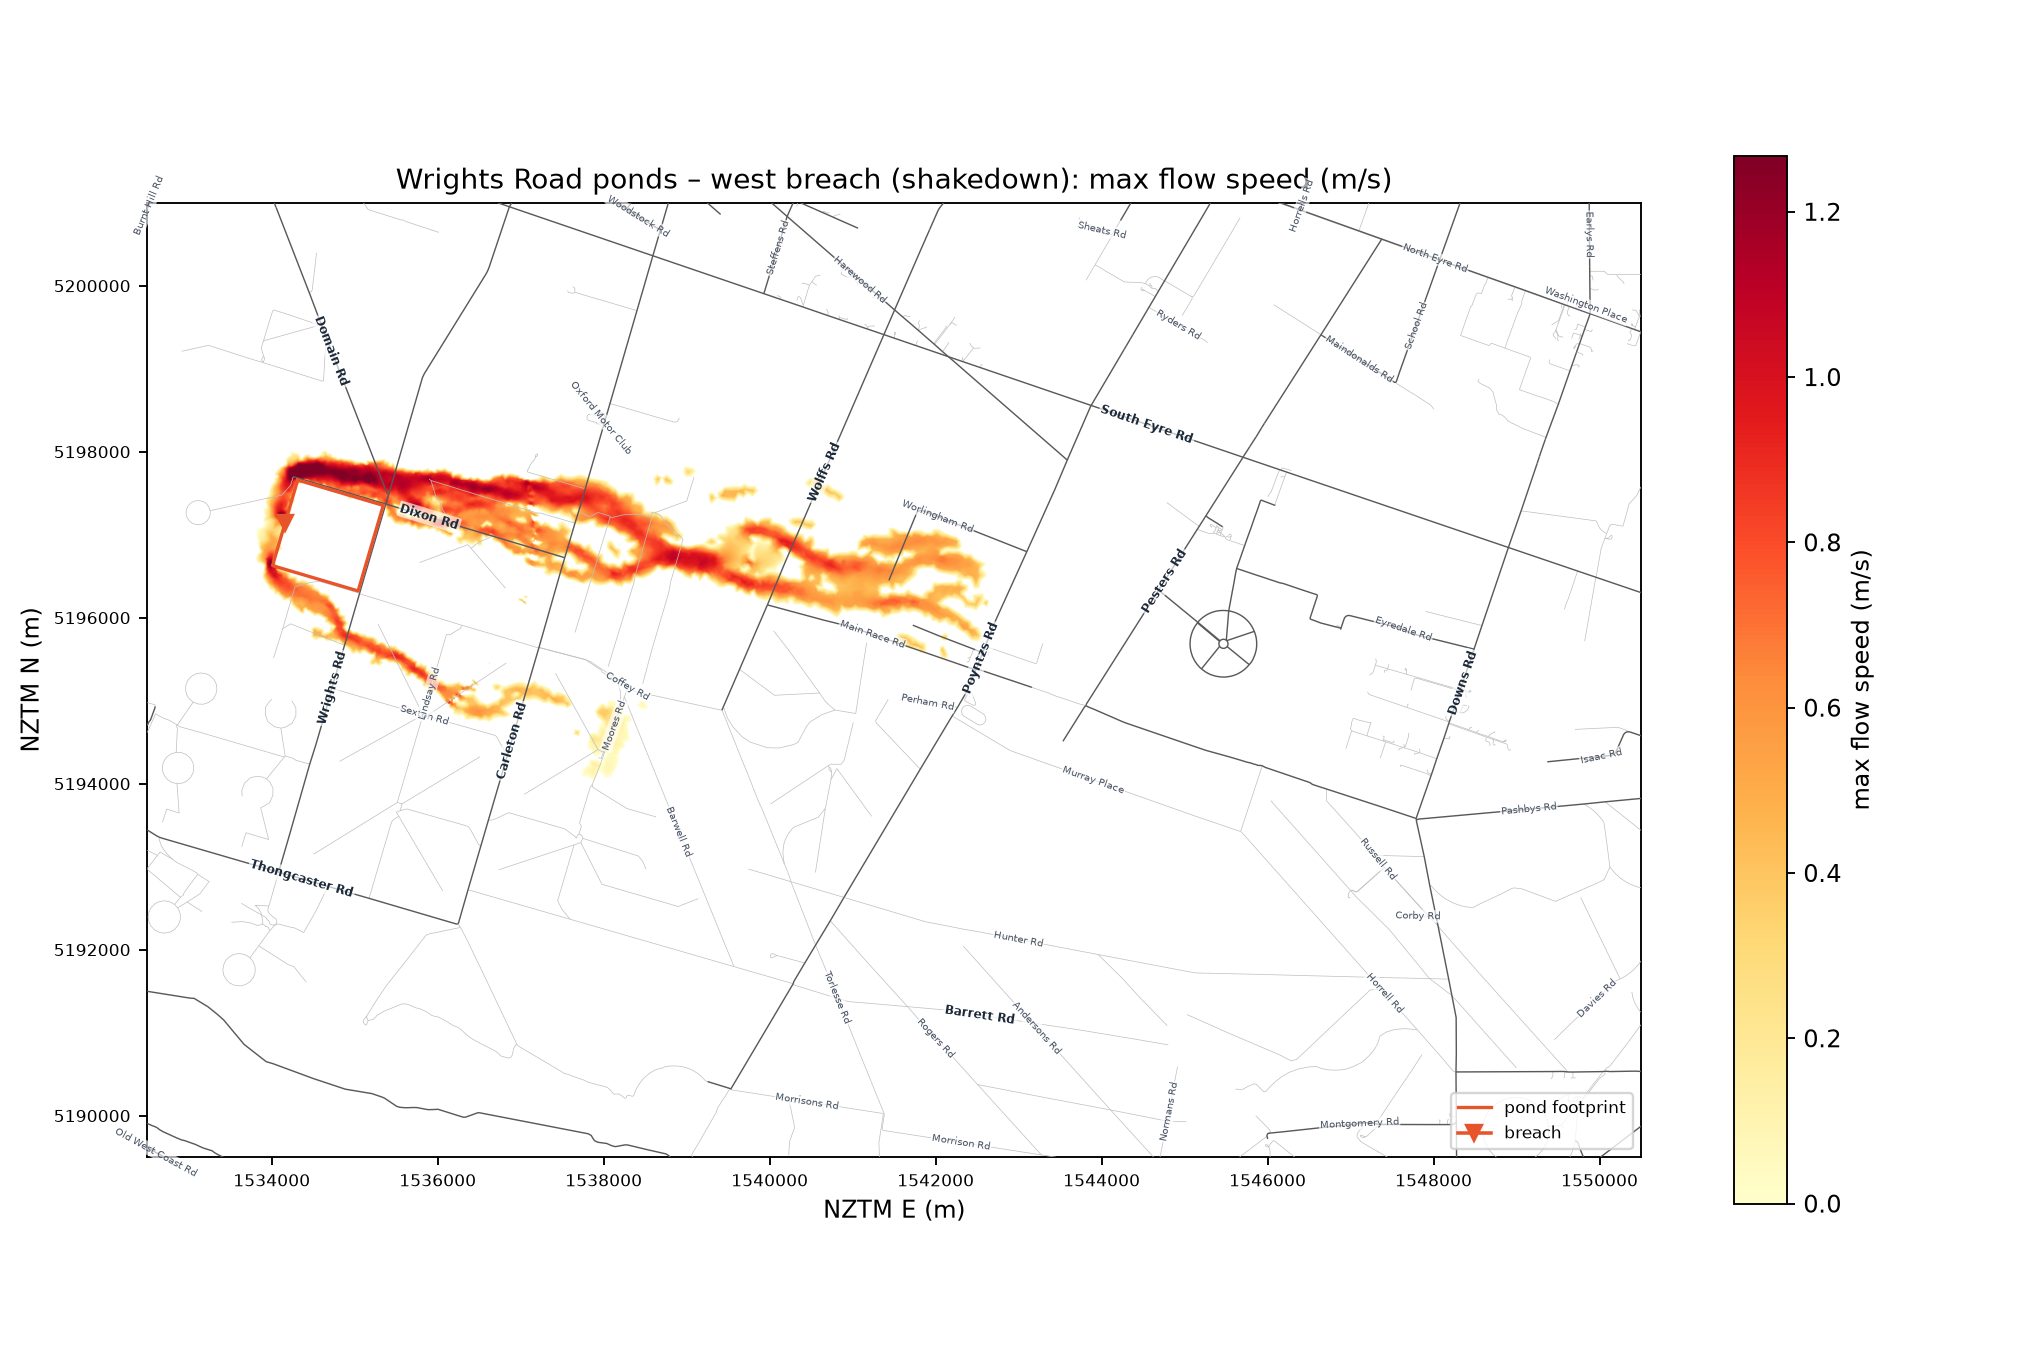
Maximum flow speed
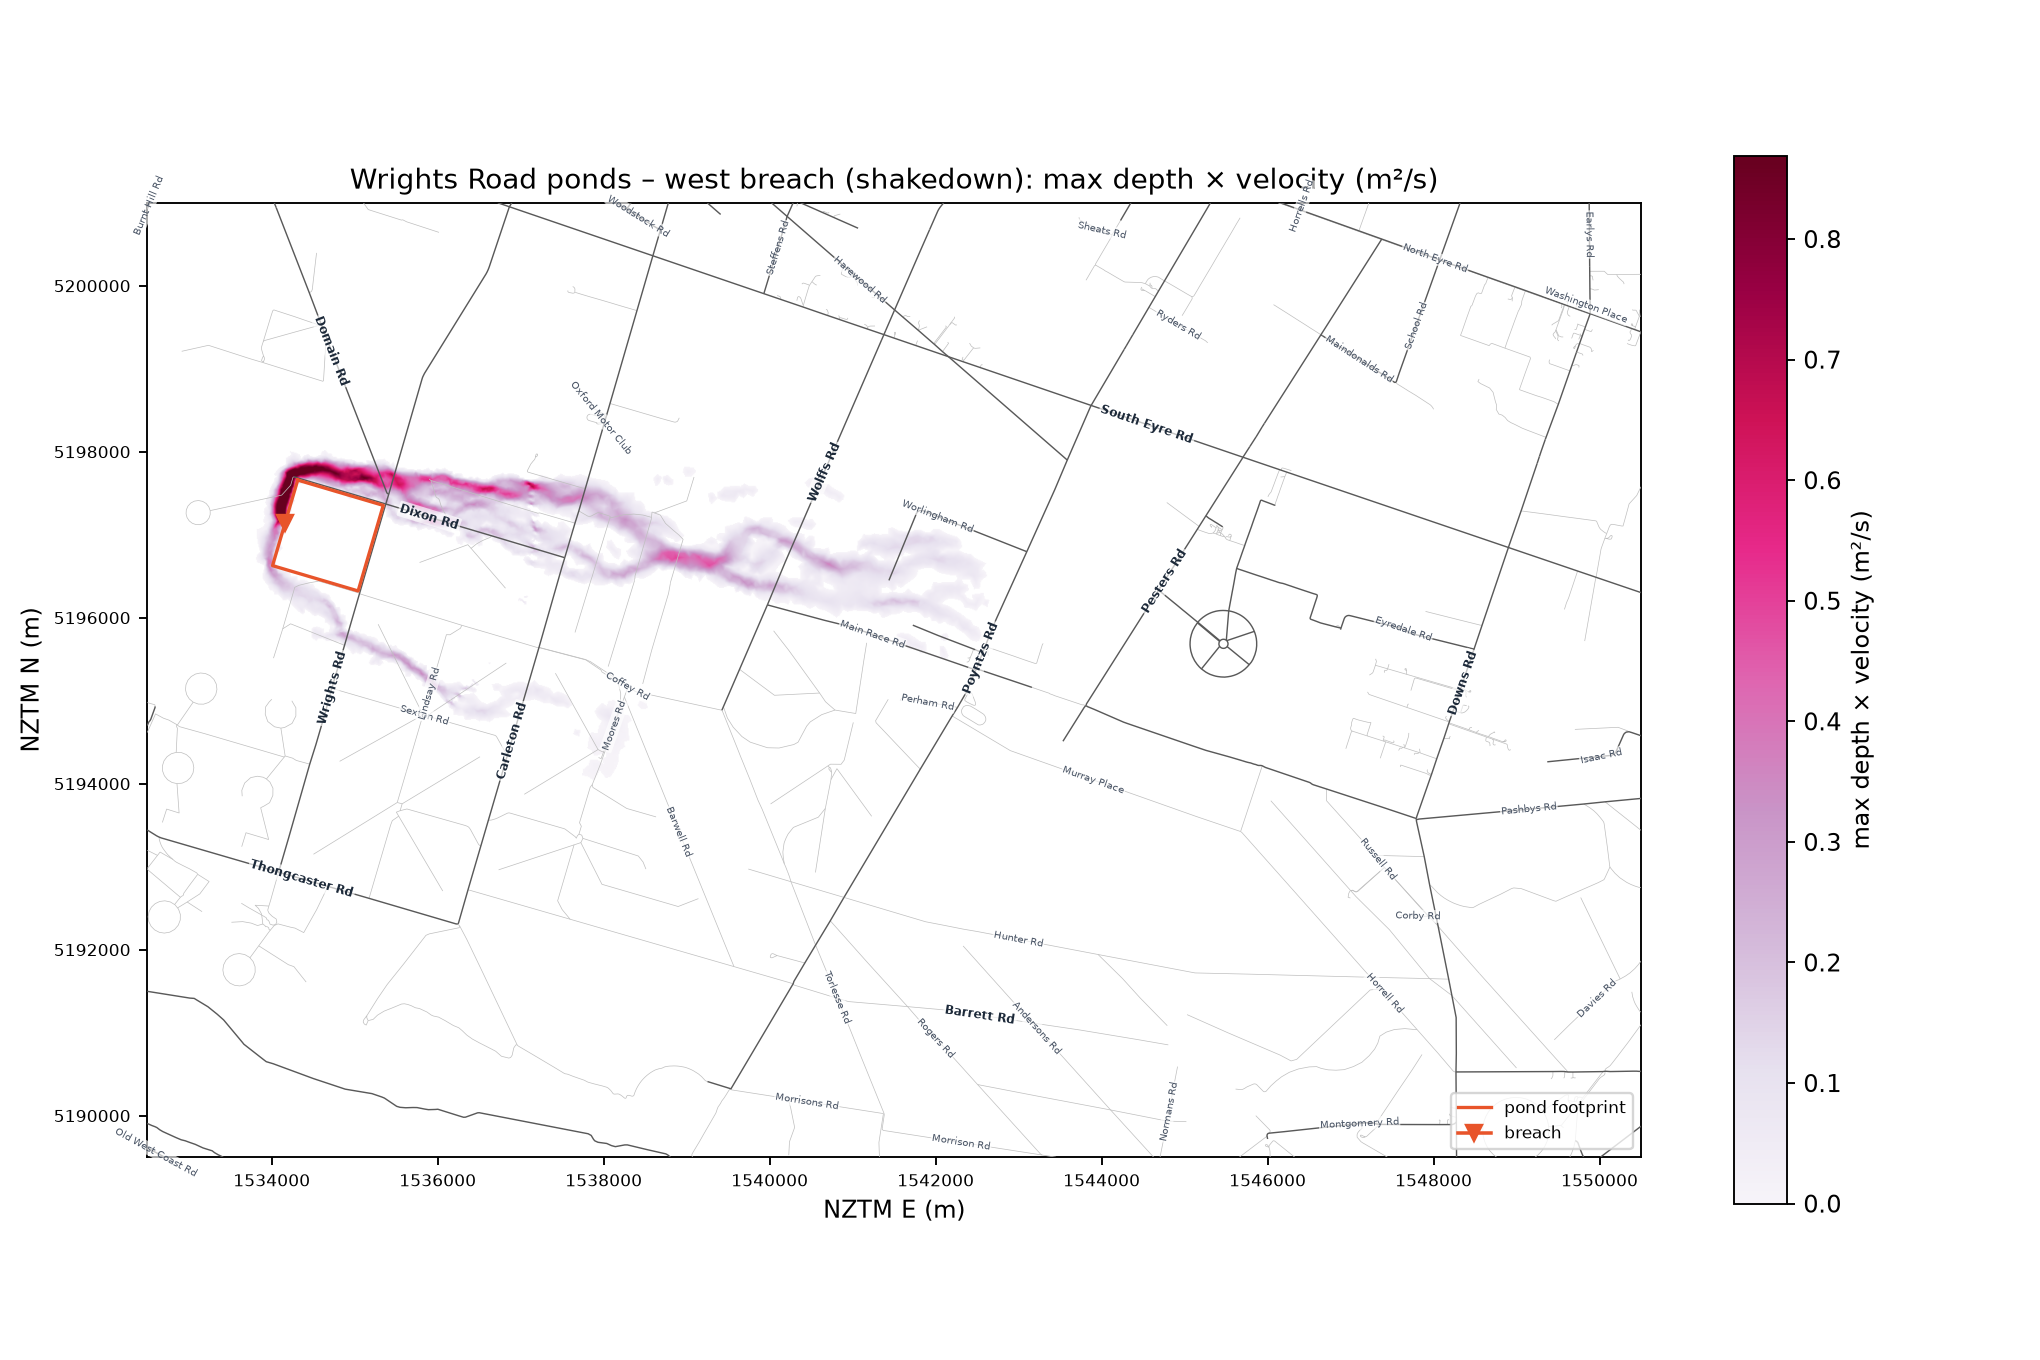
Depth × velocity
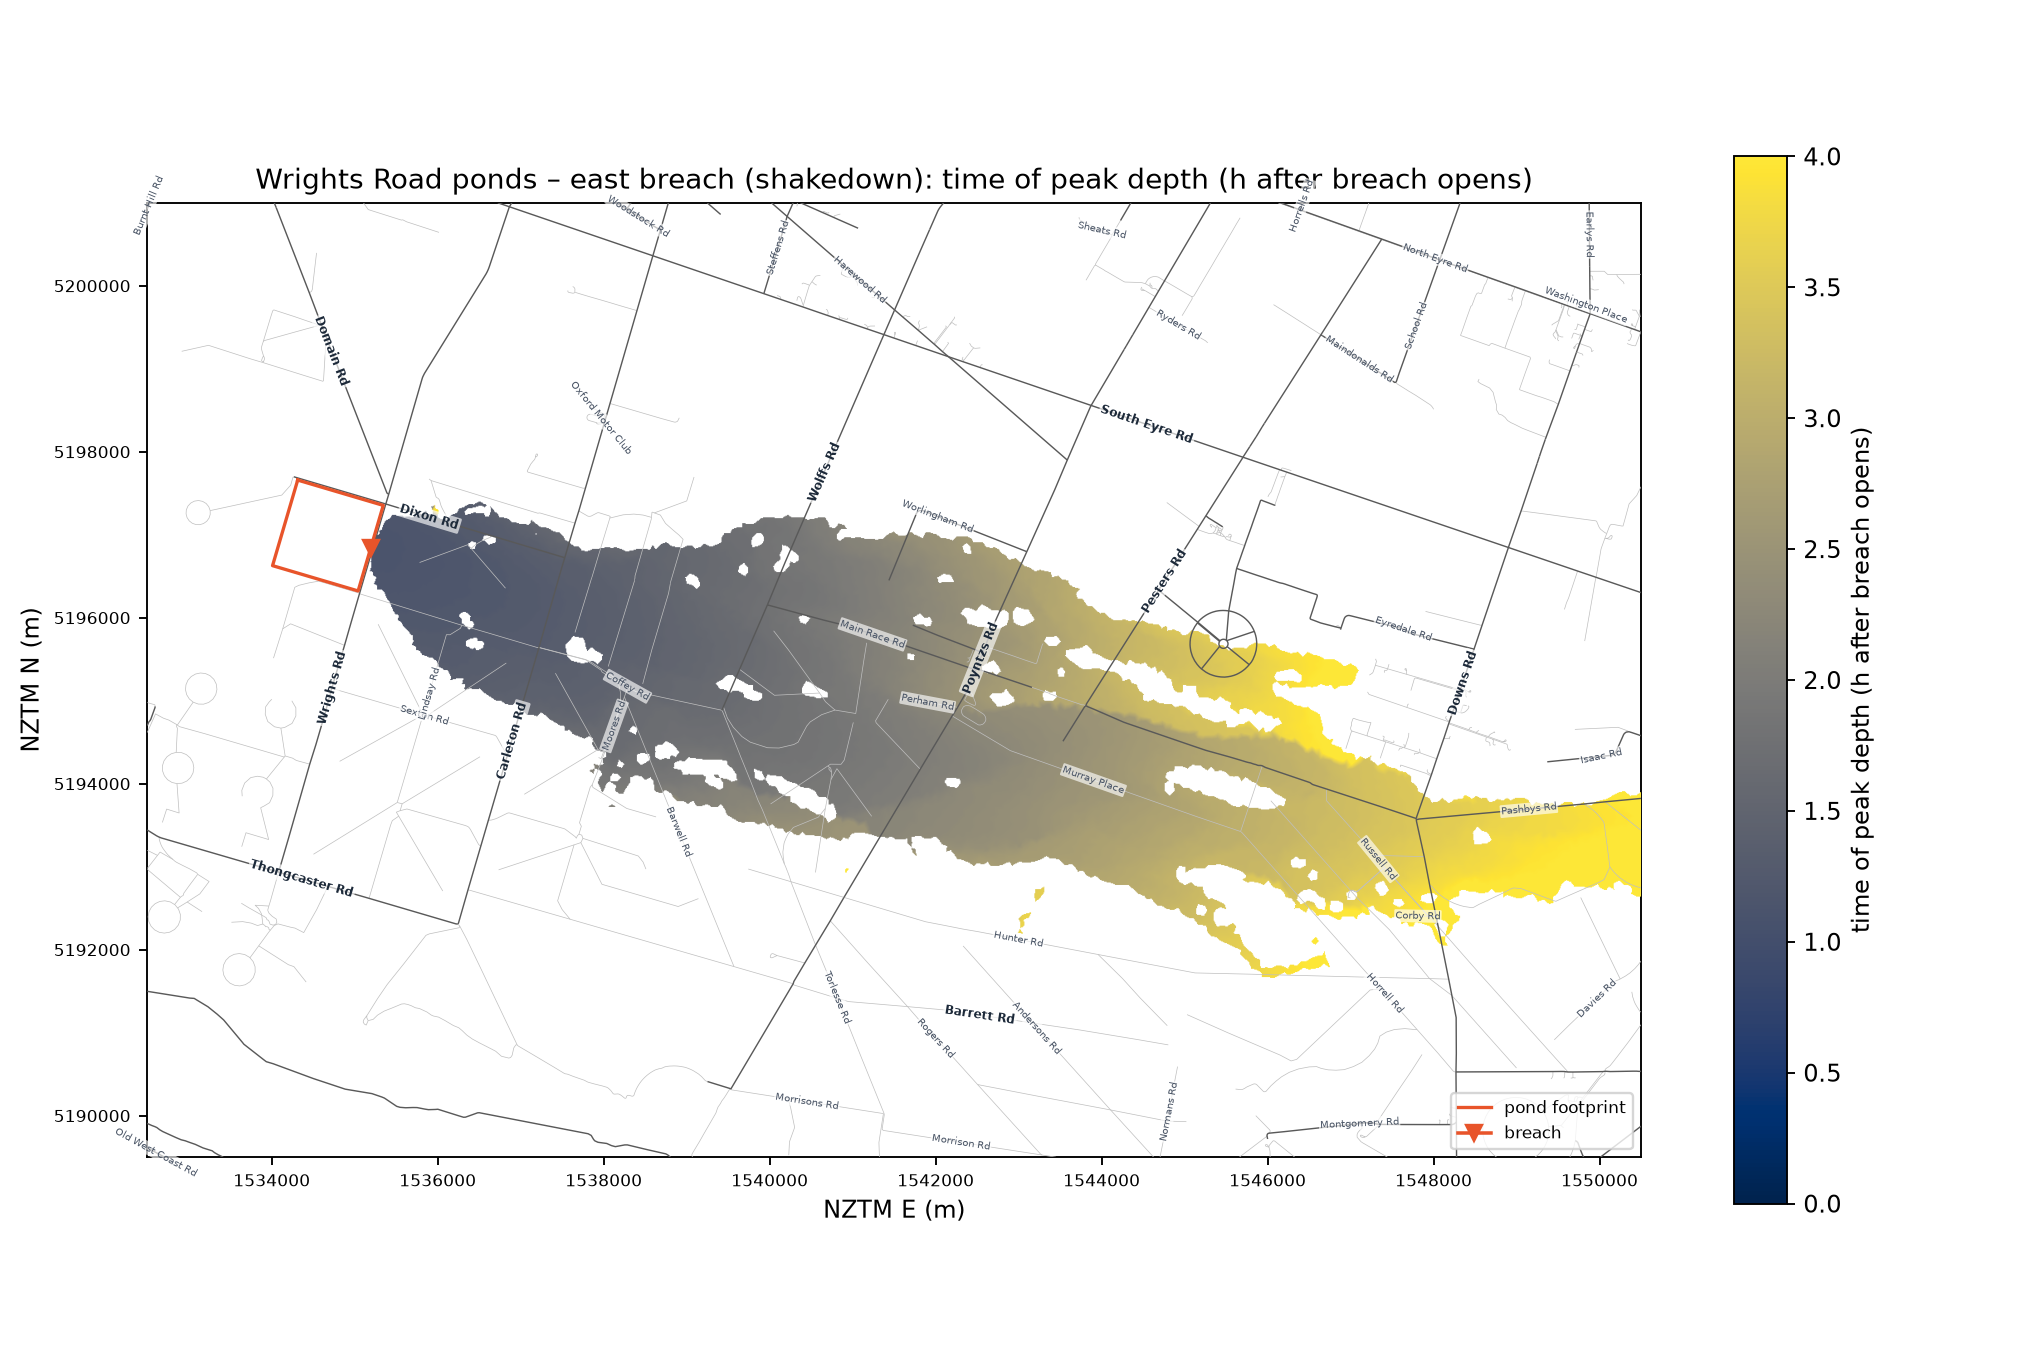
Time of peak depth
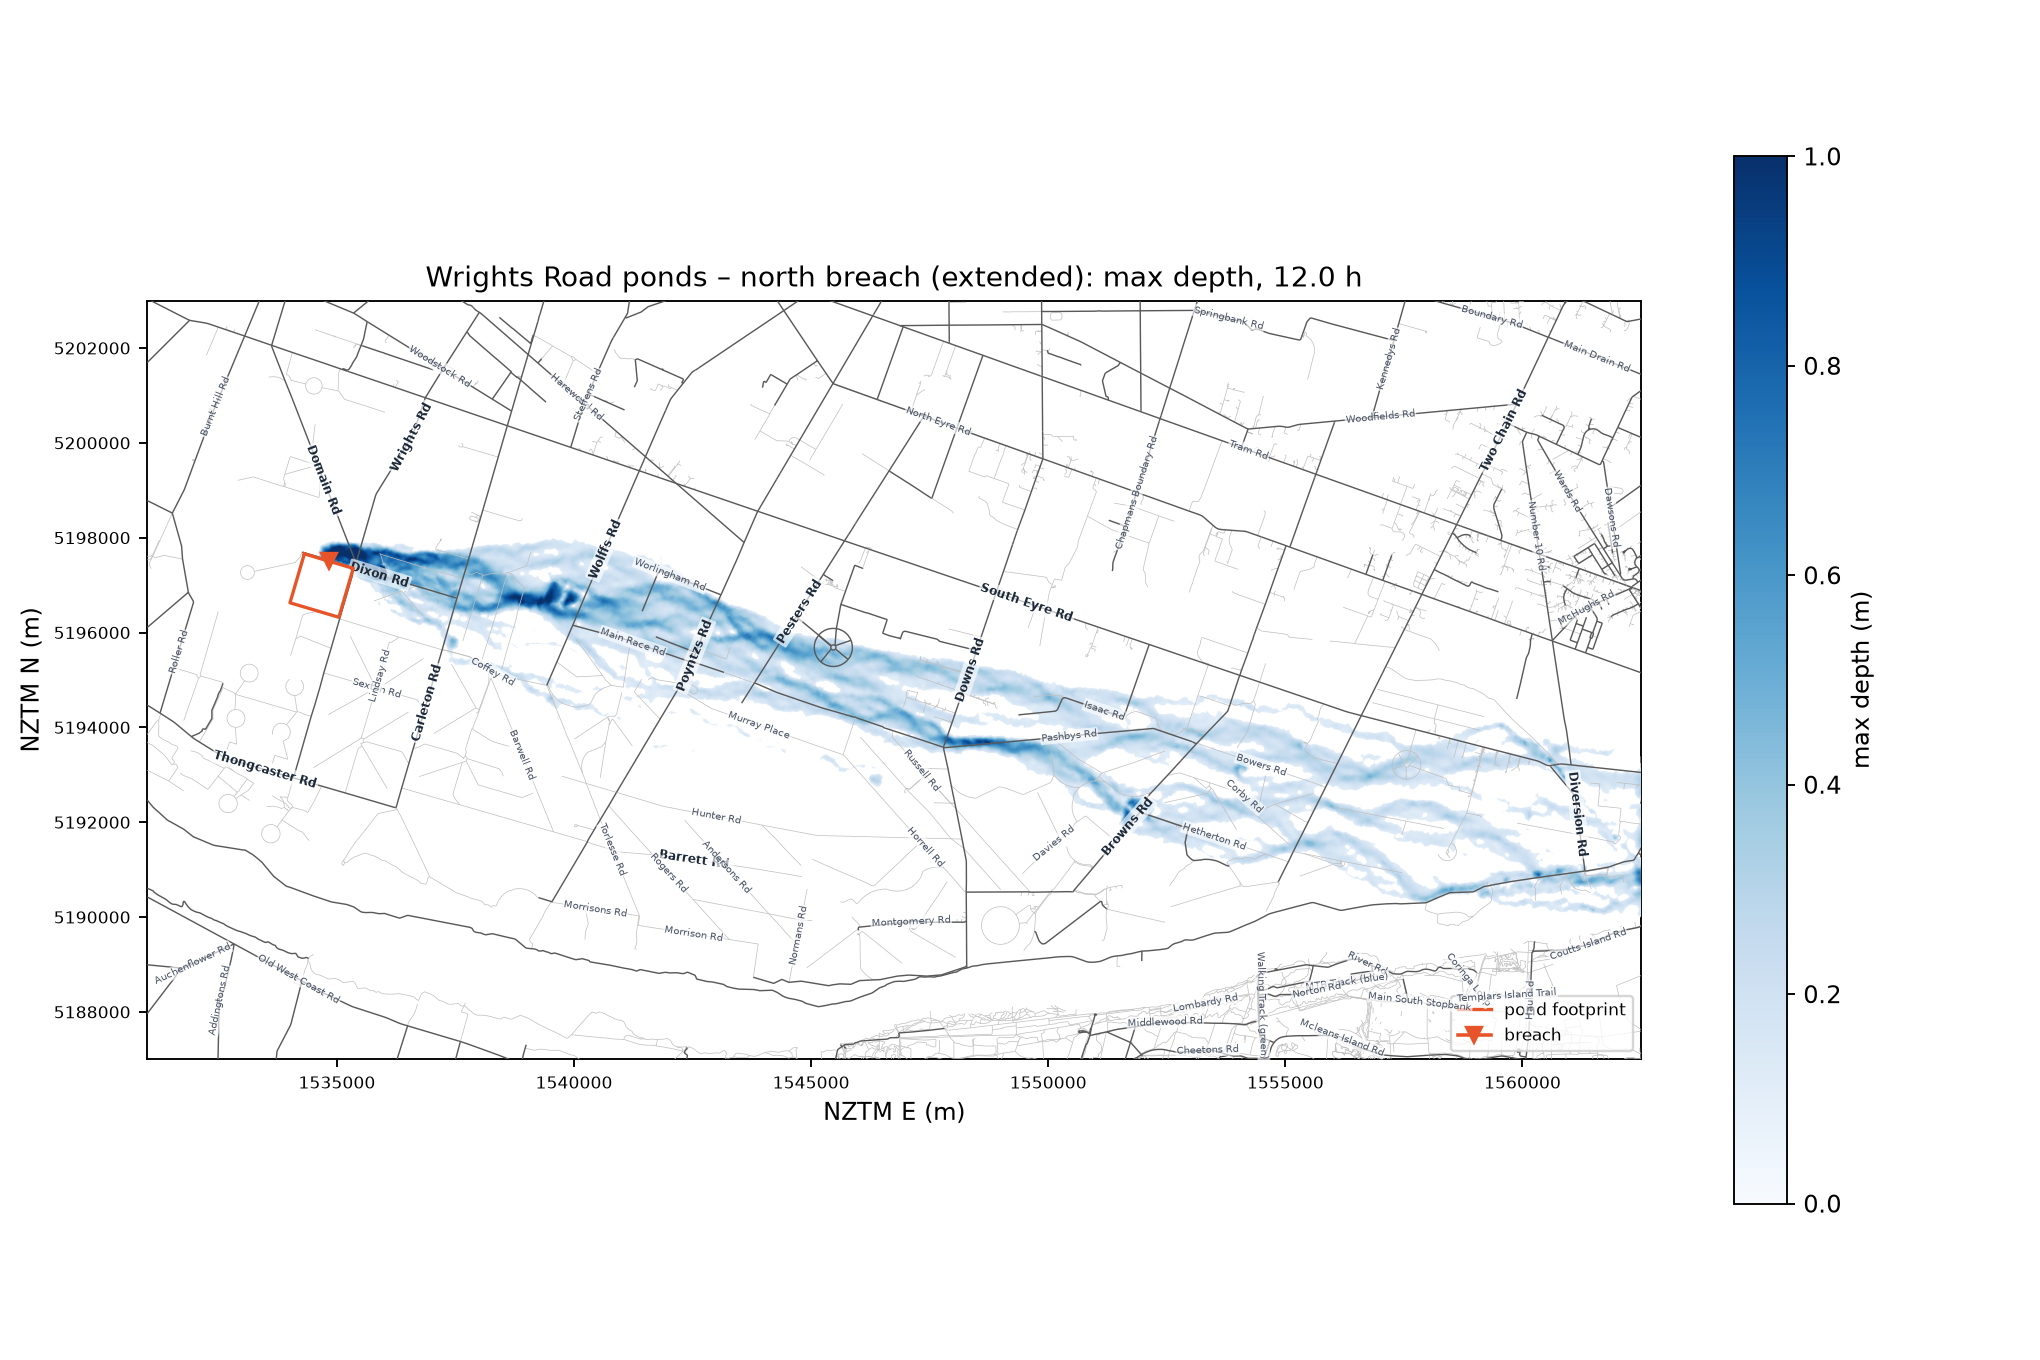
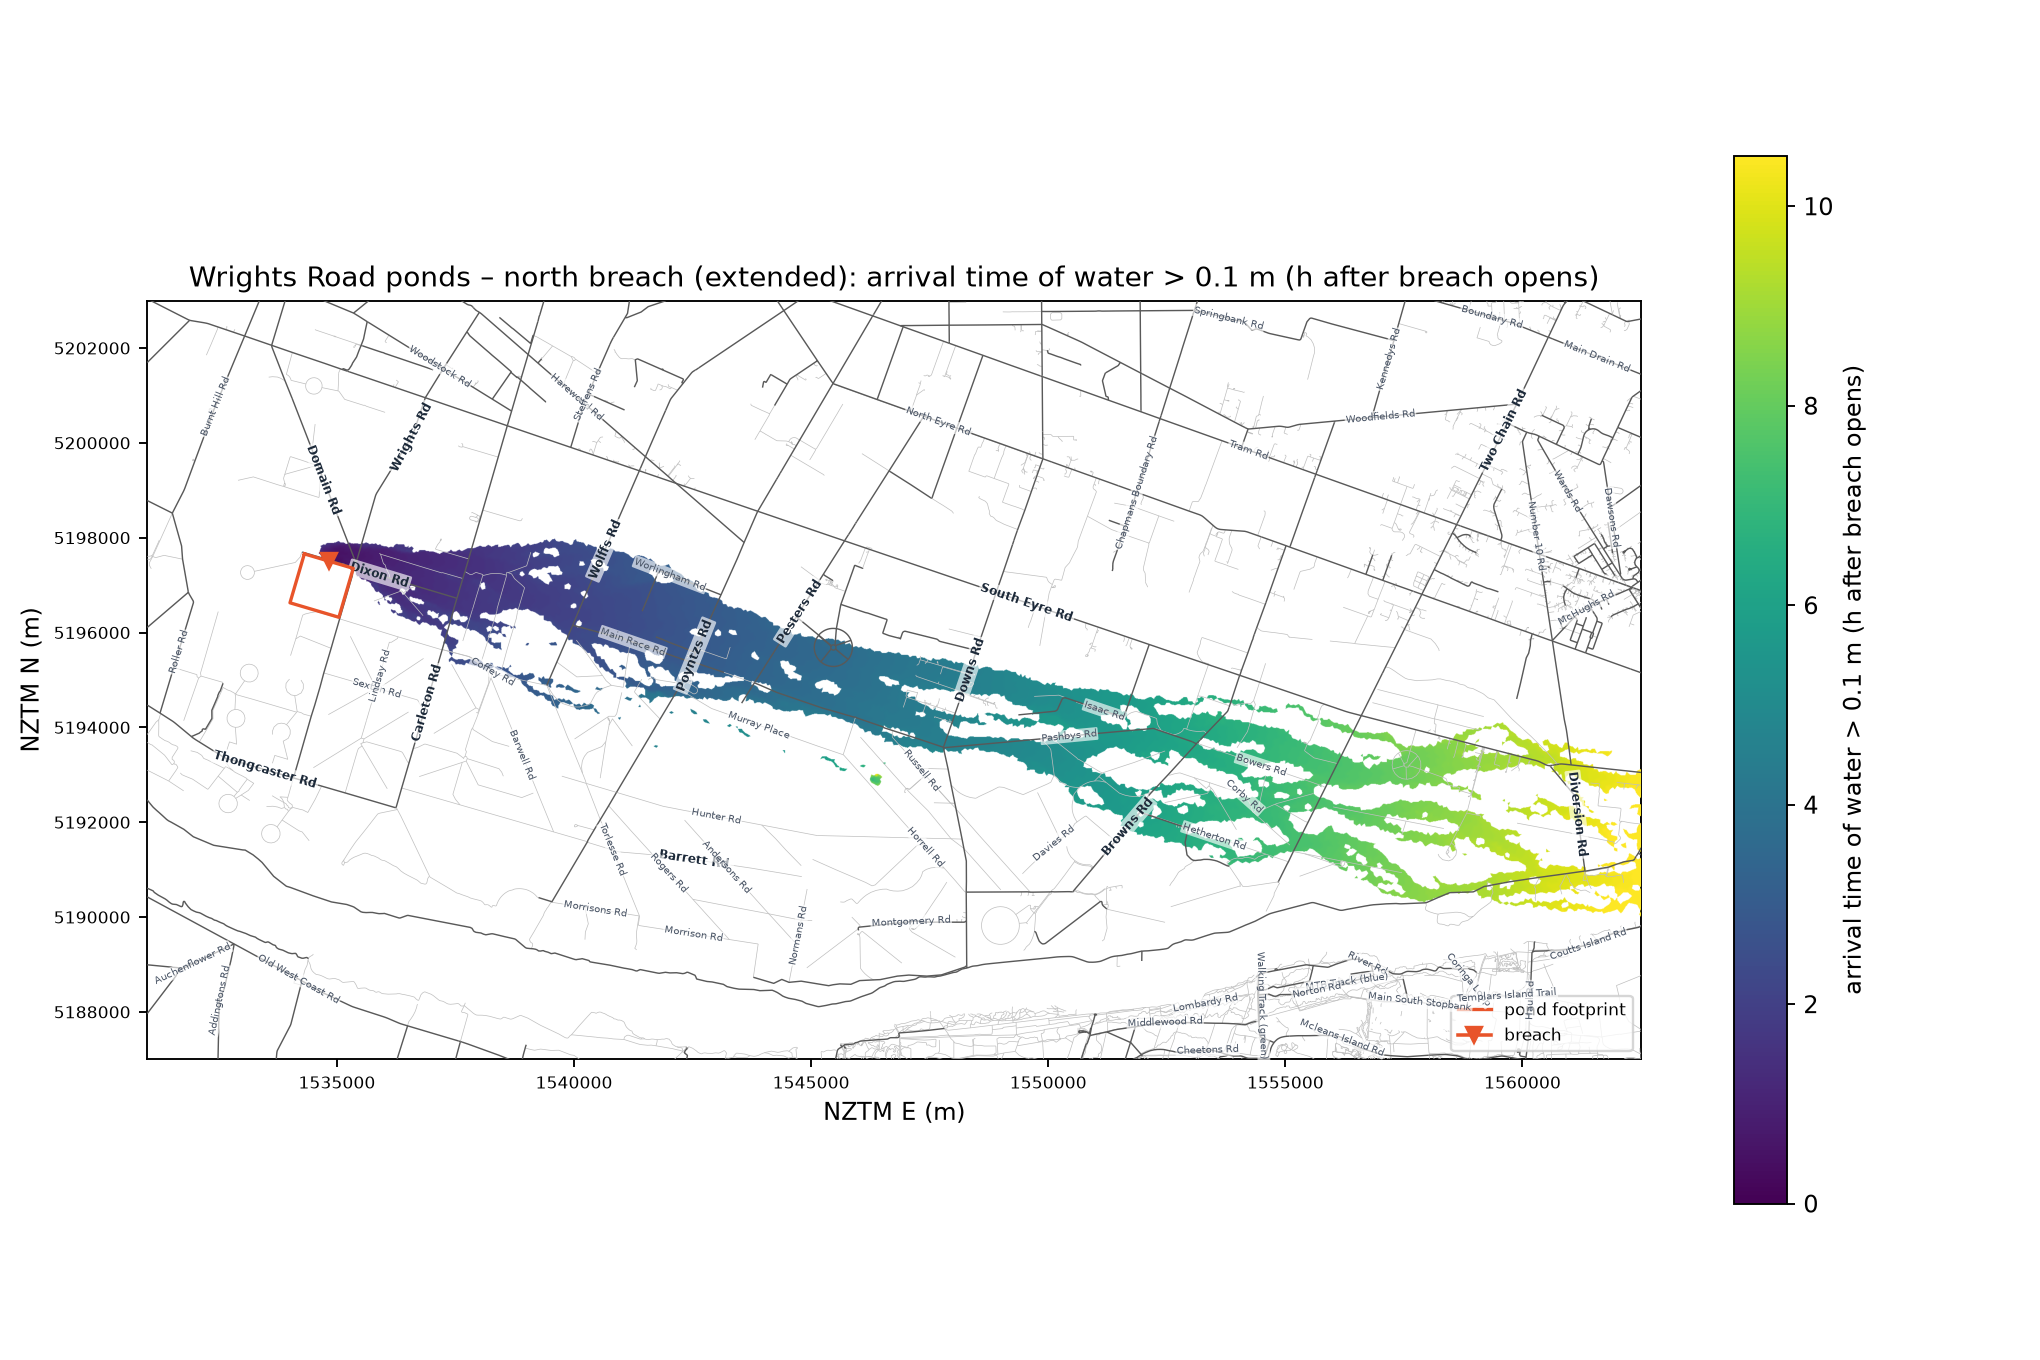
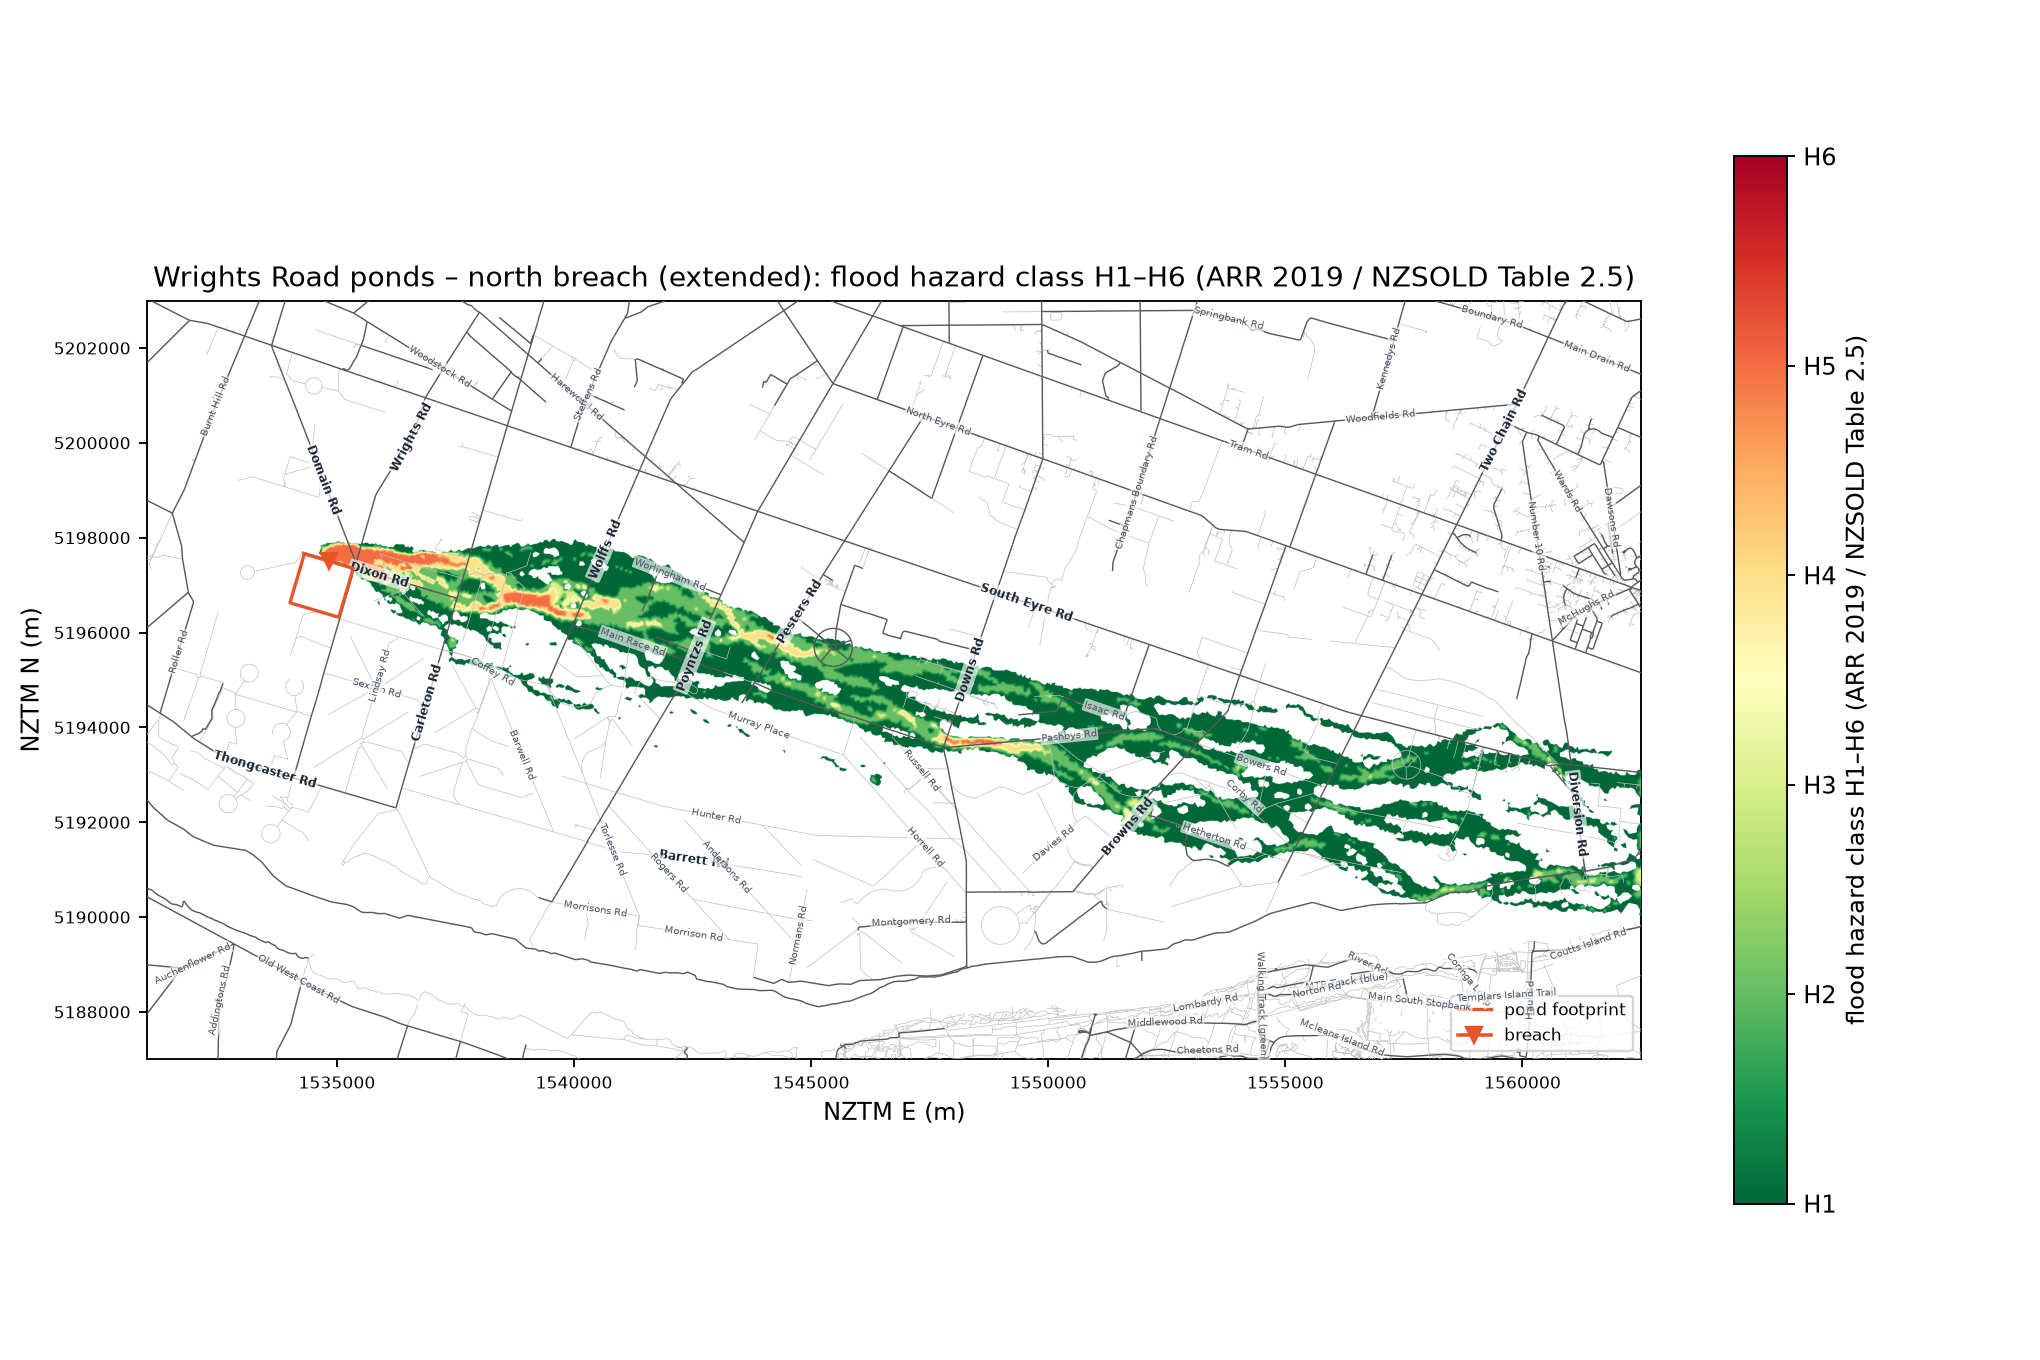
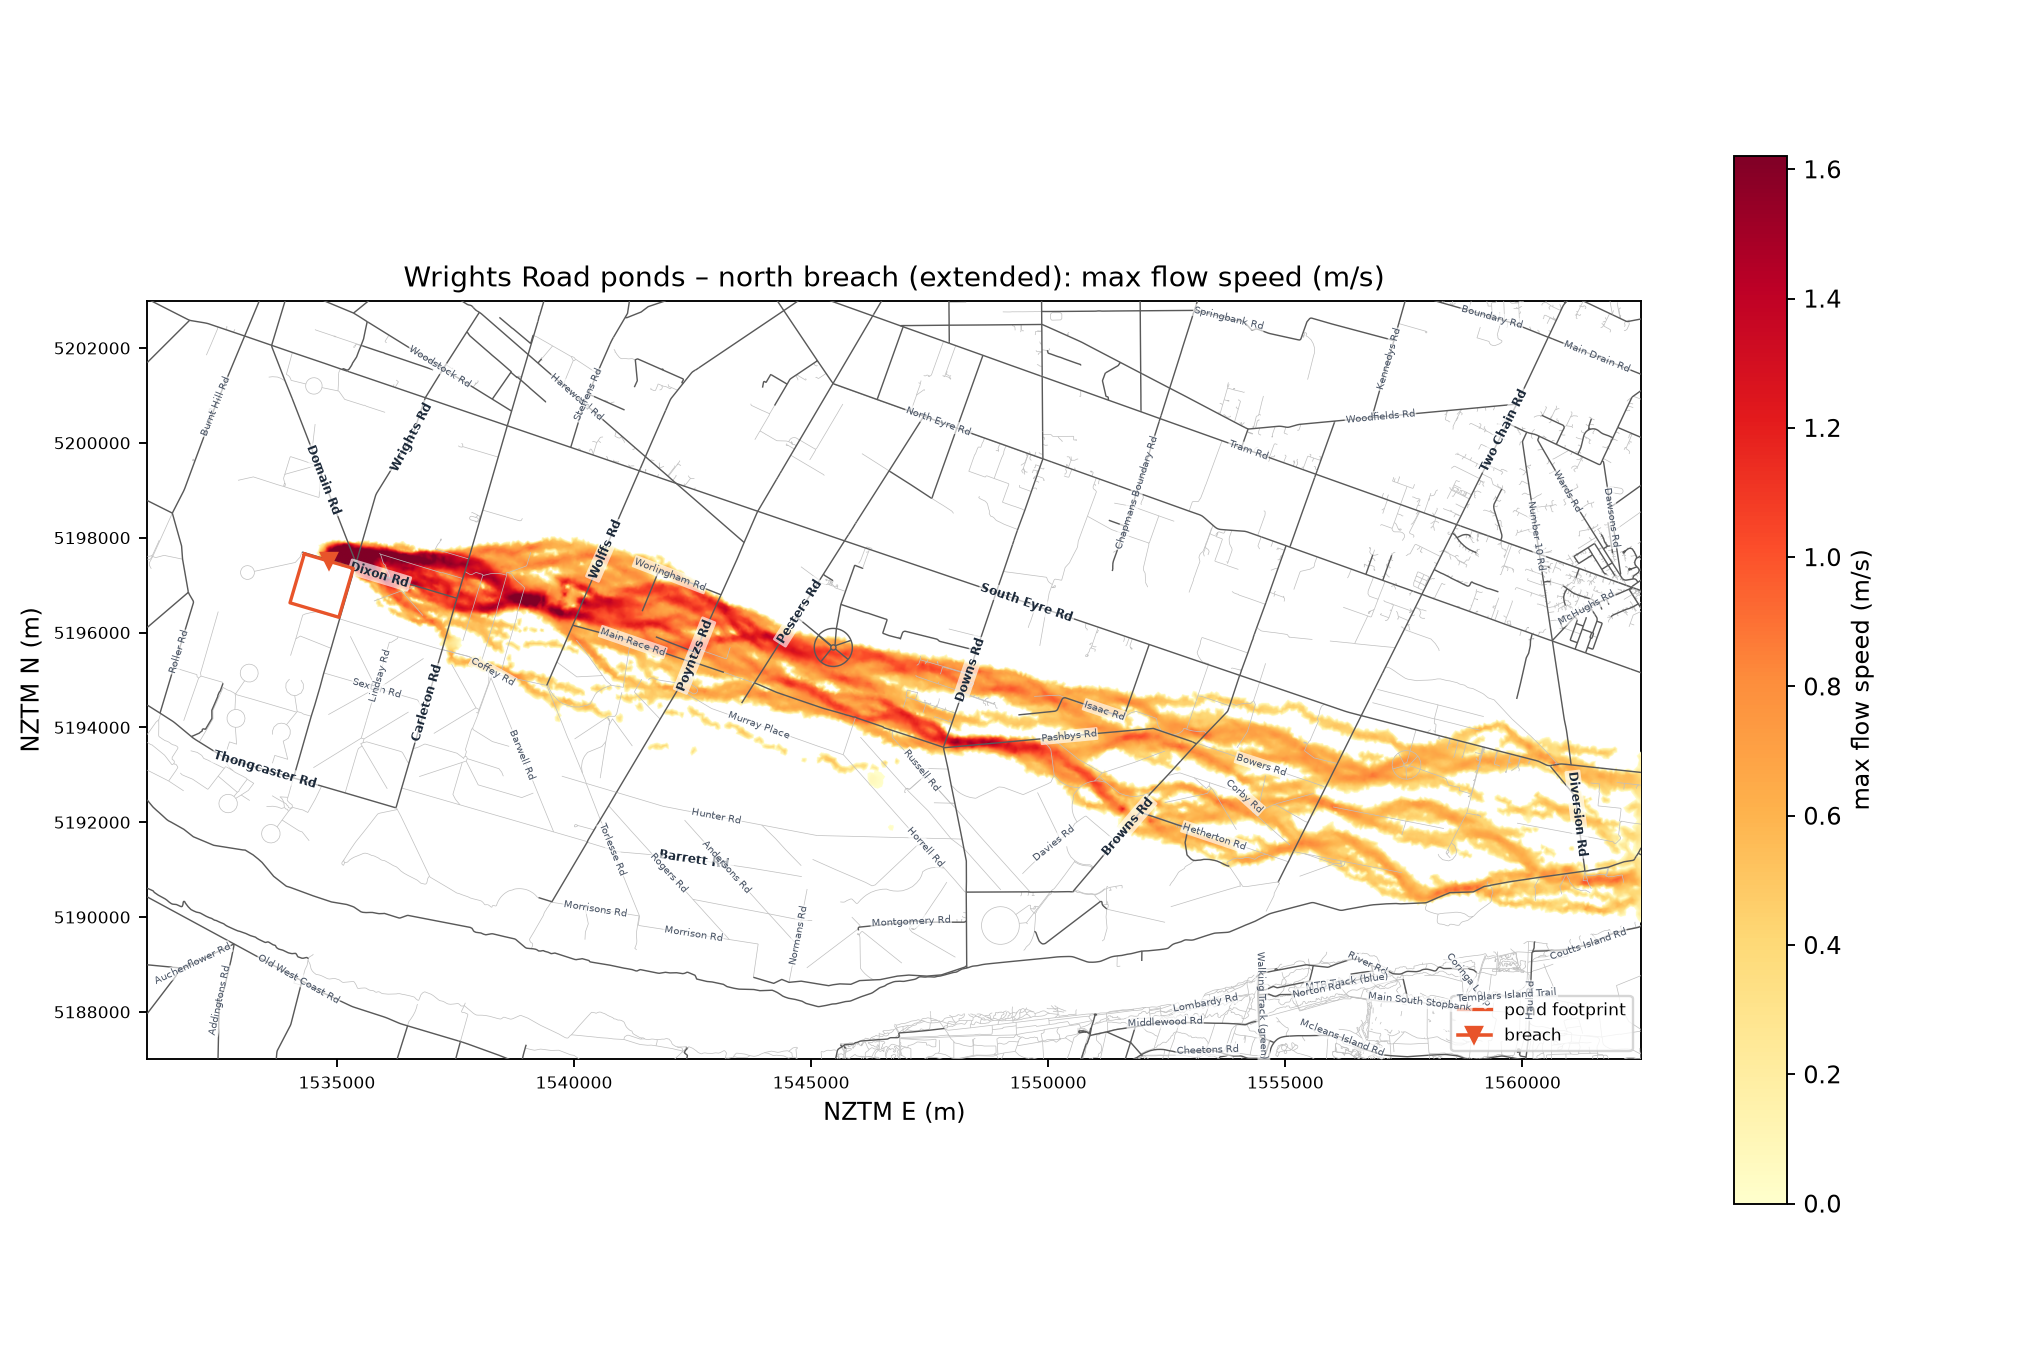
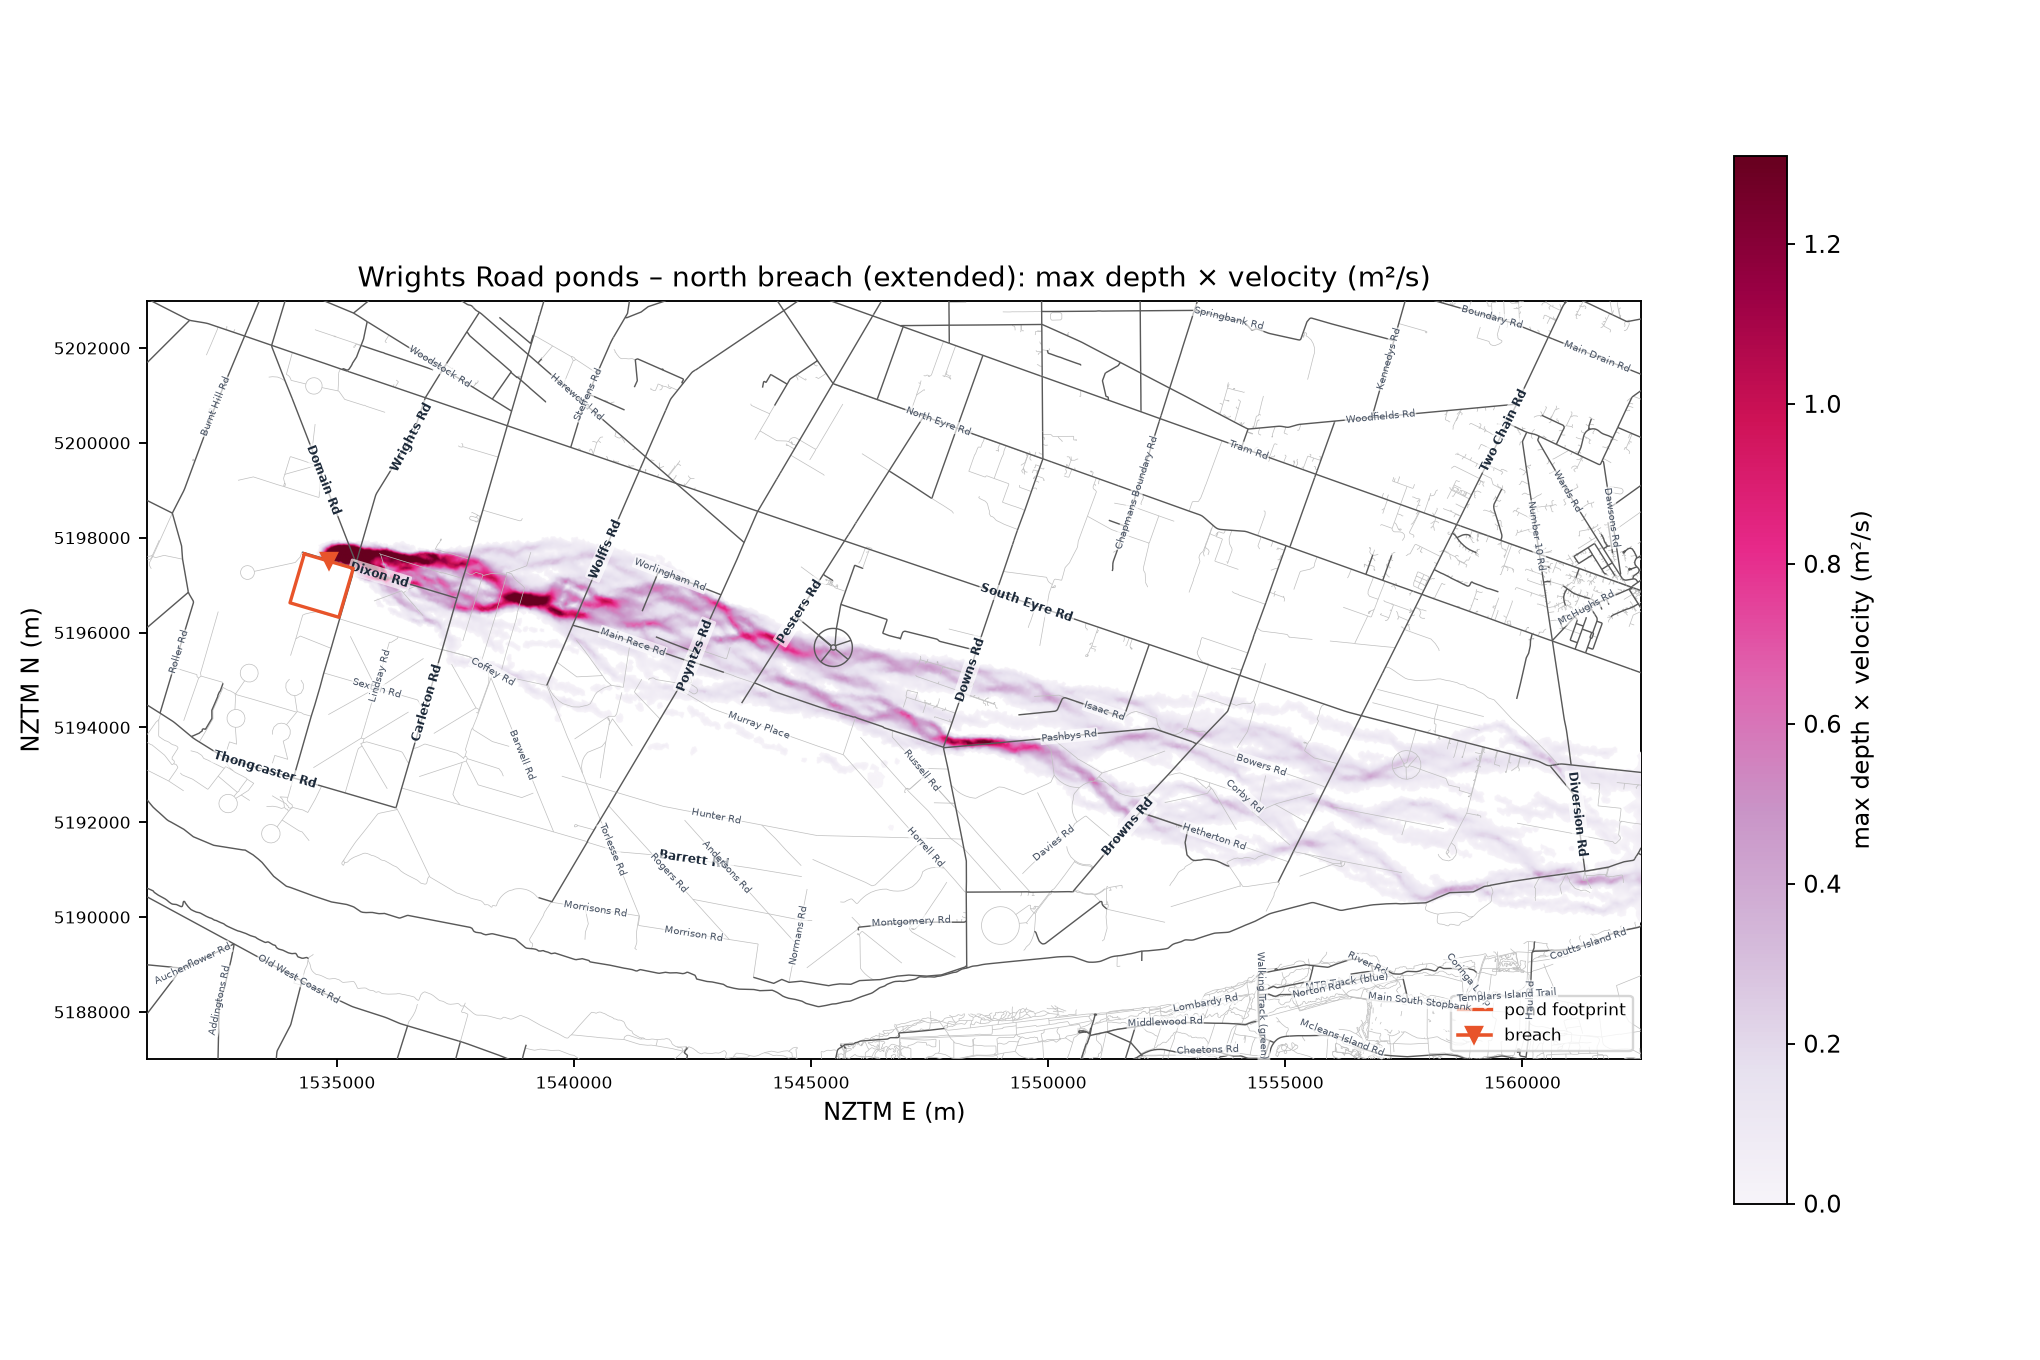
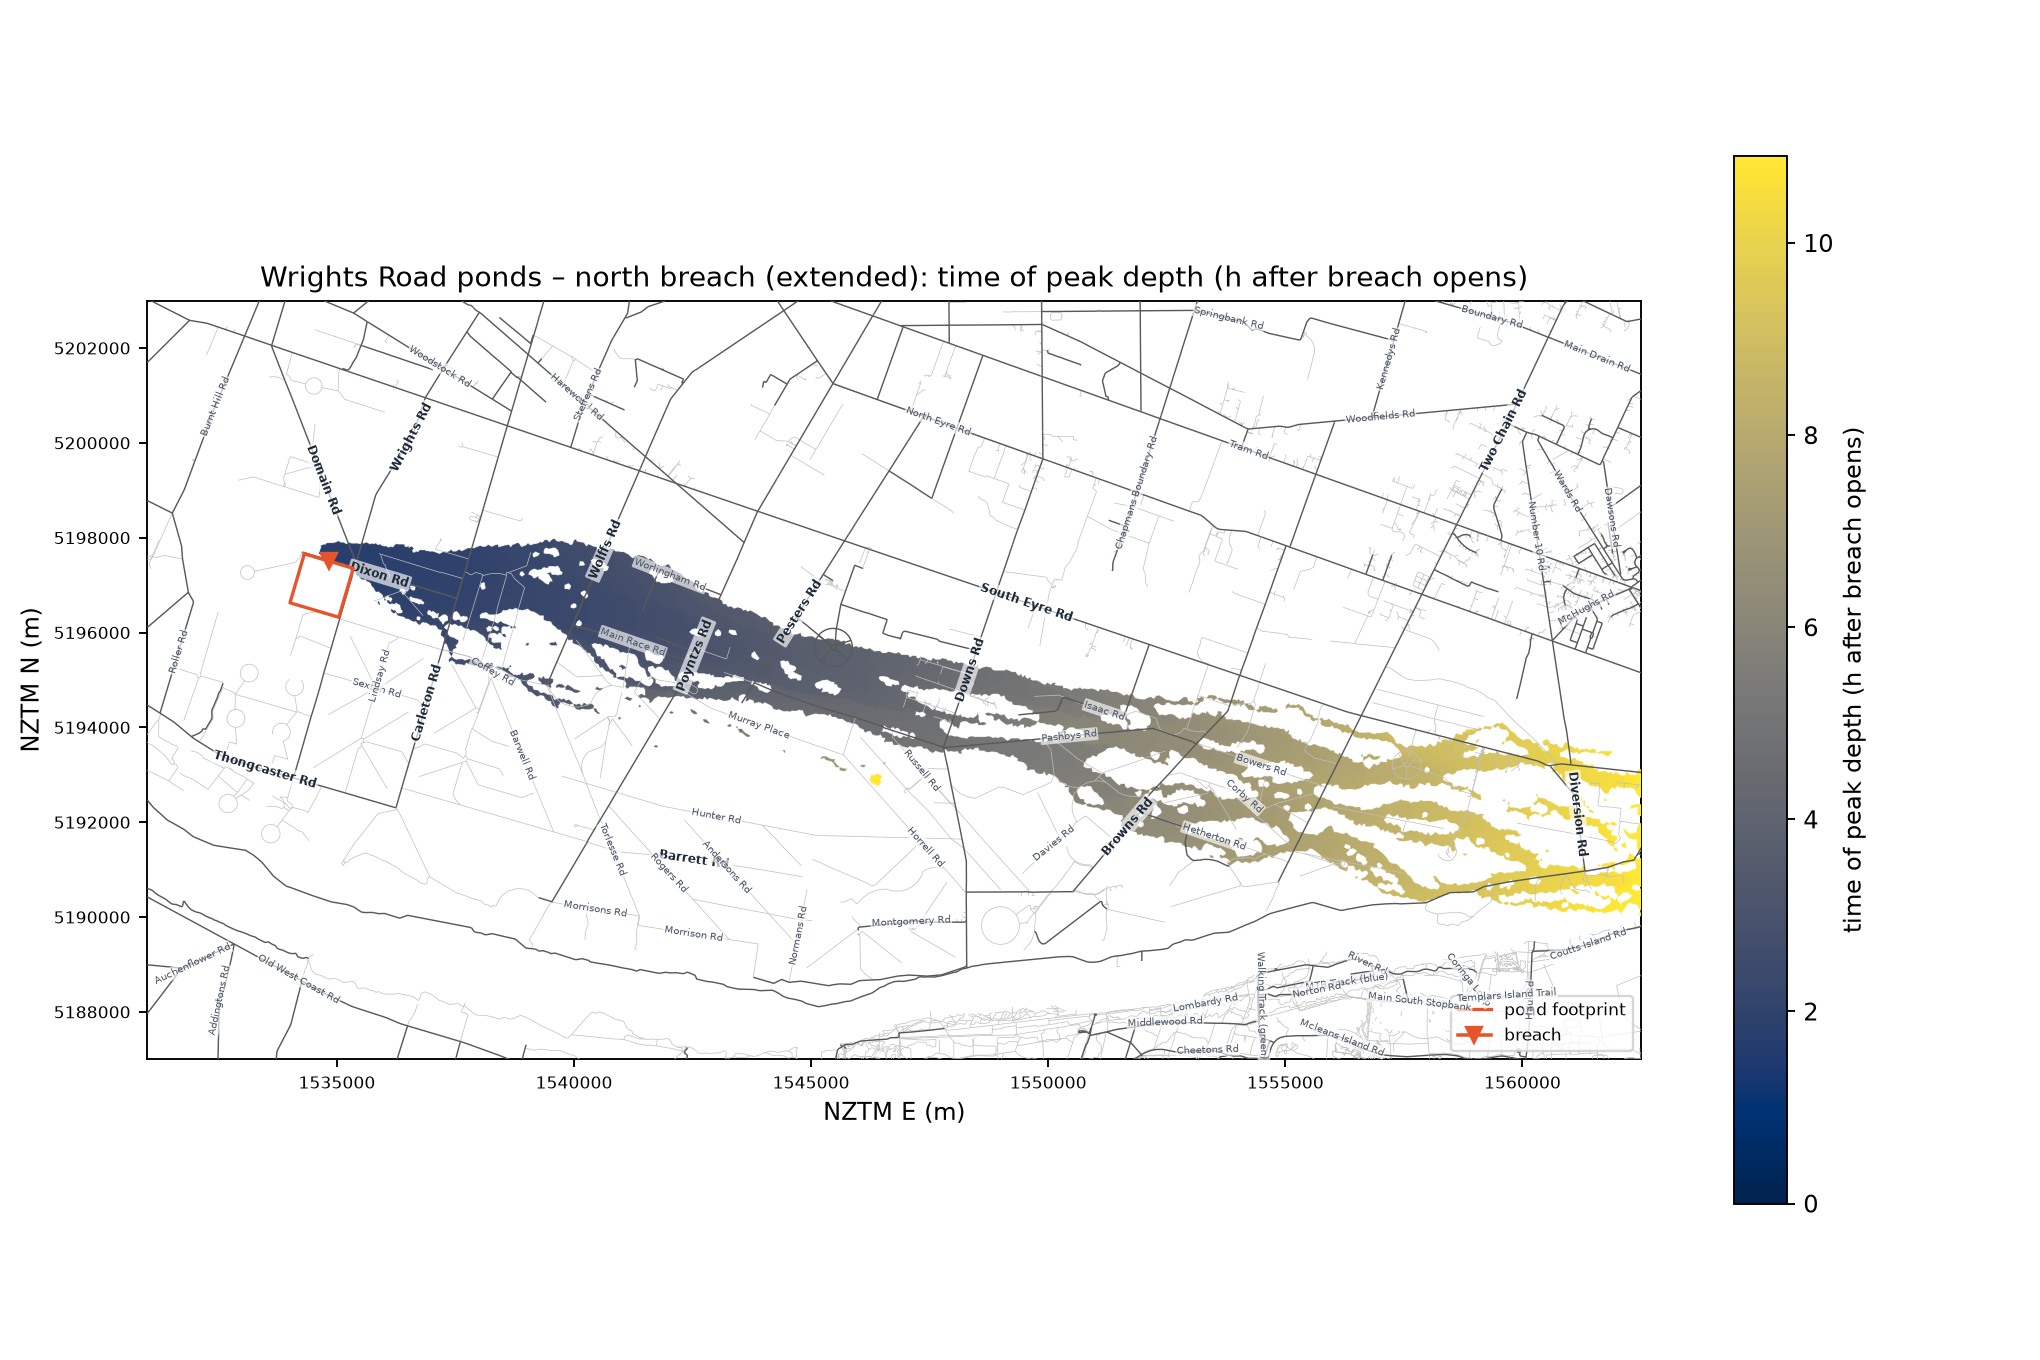
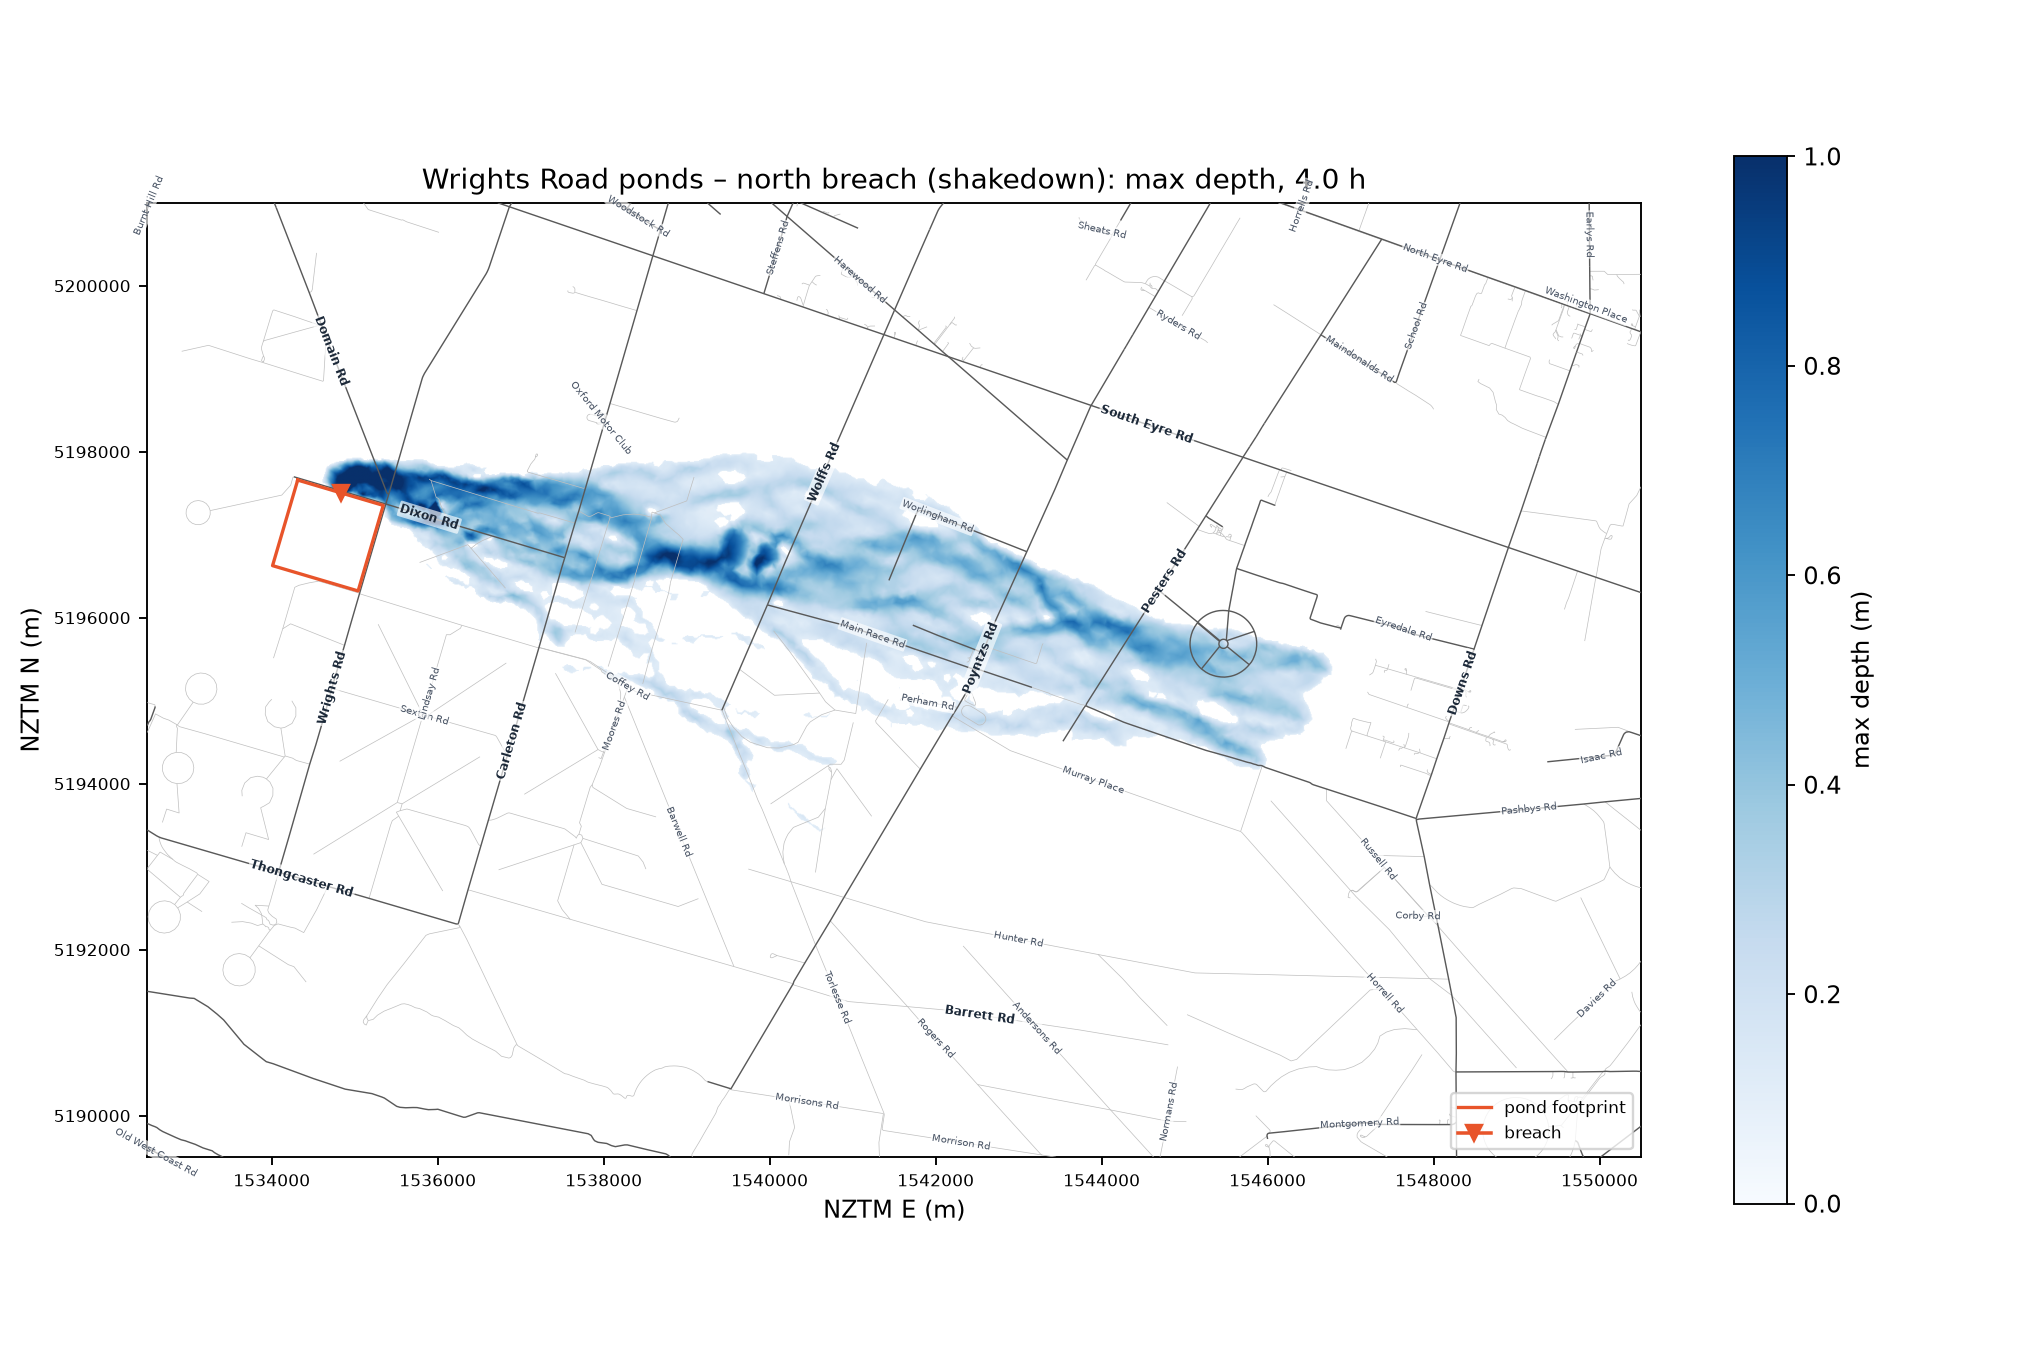
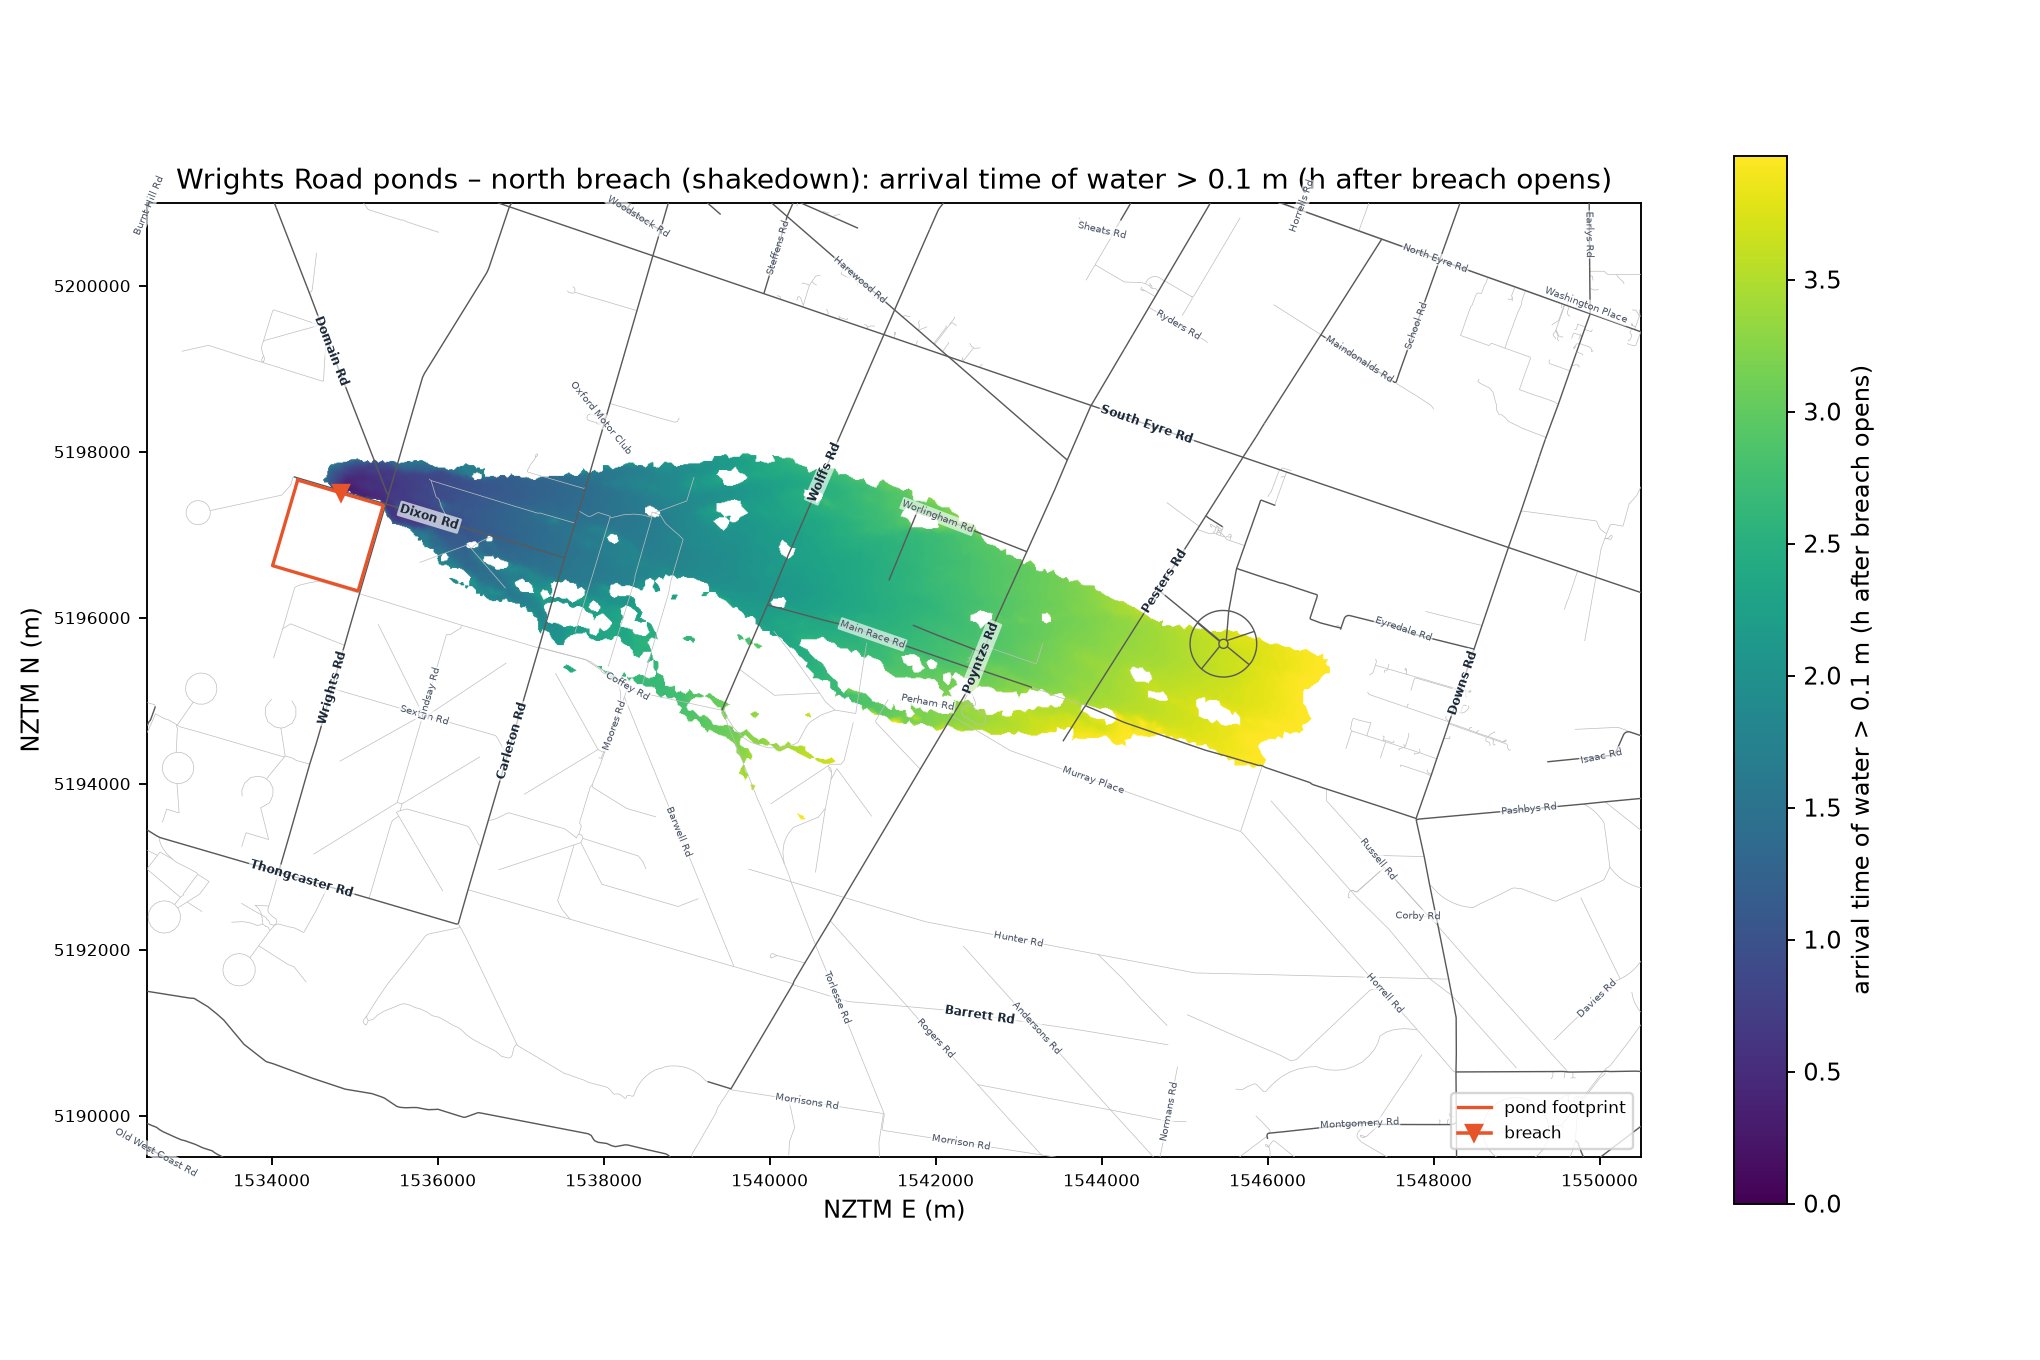
The north cascade breach (Pond 1 → Pond 2 → NORTH embankment, 4.7 Mm³ released, peak 817 m³/s, invert
216.7 m) routed in 2D in two steps: the 18 × 11.5 km shakedown domain for 4 h (95,000 triangles, current
repaired mesh) and the full 31.5 × 16 km domain to Diversion Road for 12 h (201,000 triangles). Same 20 m
LiDAR grid, mesh densities, roughness (n = 0.045) and hydrograph basis as the east runs. Outputs:
outputs/north/*_shakedown.* and outputs/north/*_extended.*; animations:
docs/north (4 h, 60 m cells) and
docs/north-extended (12 h, 80 m cells,
10-min frames). Wall-clock on one core: ~2 min (shakedown) and ~10 min (extended) – far less than the east runs
because the lower peak keeps the wet area and velocities small.
| Metric | North, shakedown (4 h) | North, extended (12 h) | Damwatch 2012 (north) |
|---|---|---|---|
| Inundated area > 0.1 m (km²) | 20.4 | 49.4 | flood zone 66 |
| Deepest water (m) | 2.3 | 1.9 | – |
| Fastest flow (m/s) | 3.1 | 2.8 | – |
| Buildings > 0.1 m / ≥ 0.5 m | 373 / 17 | 680 / 30 | households in zone 198 / at risk 35 |
| PAR screening (2.5 persons per at-risk building) | 43 | 75 | 95 |
| Wet area at end of run (km²) | 18.1 | 21.2 (peak 28.3 at 9.5 h, draining to the river) | – |
Times are hours after the Pond 2 breach opens (2.2 h after the Pond 1 failure begins). Shakedown and extended values agree within 0.04 h / 0.05 m where both reach a road; the extended values are listed.
| Road | Damwatch arrival (h) | Model arrival (h) | Damwatch depth (m) | Model max depth (m) |
|---|---|---|---|---|
| Dixon Road | – | 0.30 | – | 1.21 |
| Domain Road | – | 0.58 | – | 1.10 |
| Wrights Road (north end) | – | 0.63 | – | 1.17 |
| Carleton Road | 0.83 | 1.42 | 0.71 | 0.64 |
| Wolffs Road | 1.17 | 2.09 | 0.59 | 0.71 |
| Poyntzs Road | 1.58 | 2.89 | 0.41 | 0.69 |
| Pesters Road | 1.83 | 3.33 | 0.55 | 0.65 |
| Downs Road | 2.50 | 4.50 | 0.33 | 0.83 |
| Browns Road | 3.50 | 5.88 | 0.50 | 0.41 |
| Two Chain Road | 4.33 | 7.42 | 0.37 | 0.38 |
| South Eyre Road (east end) | – | 8.79 | – | 0.47 |
| Diversion Road | 5.58 | 9.62 | <0.1 | 0.32 |
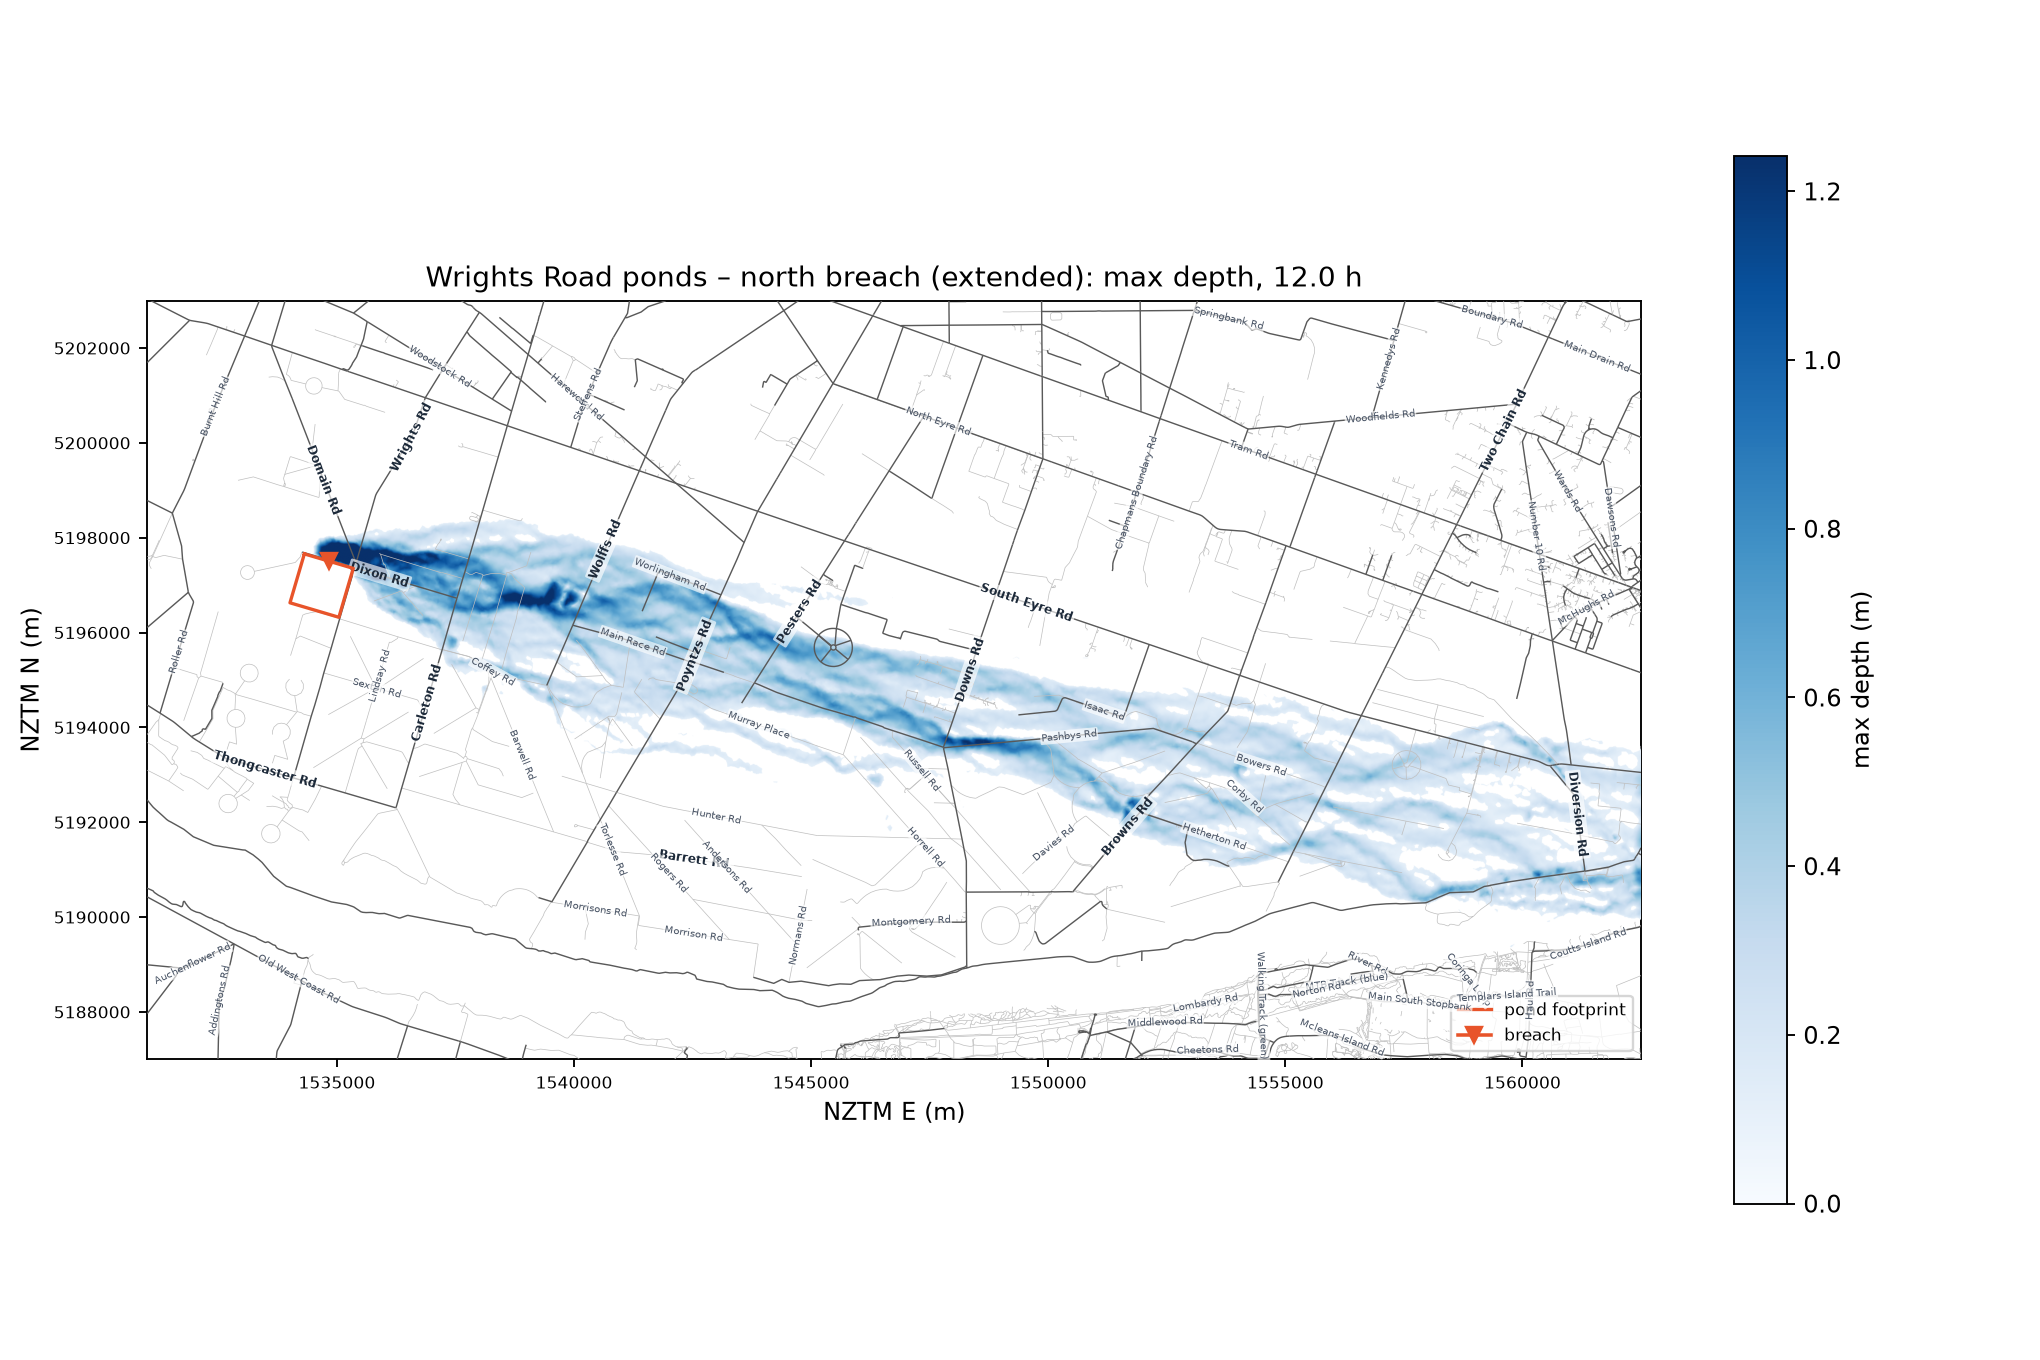
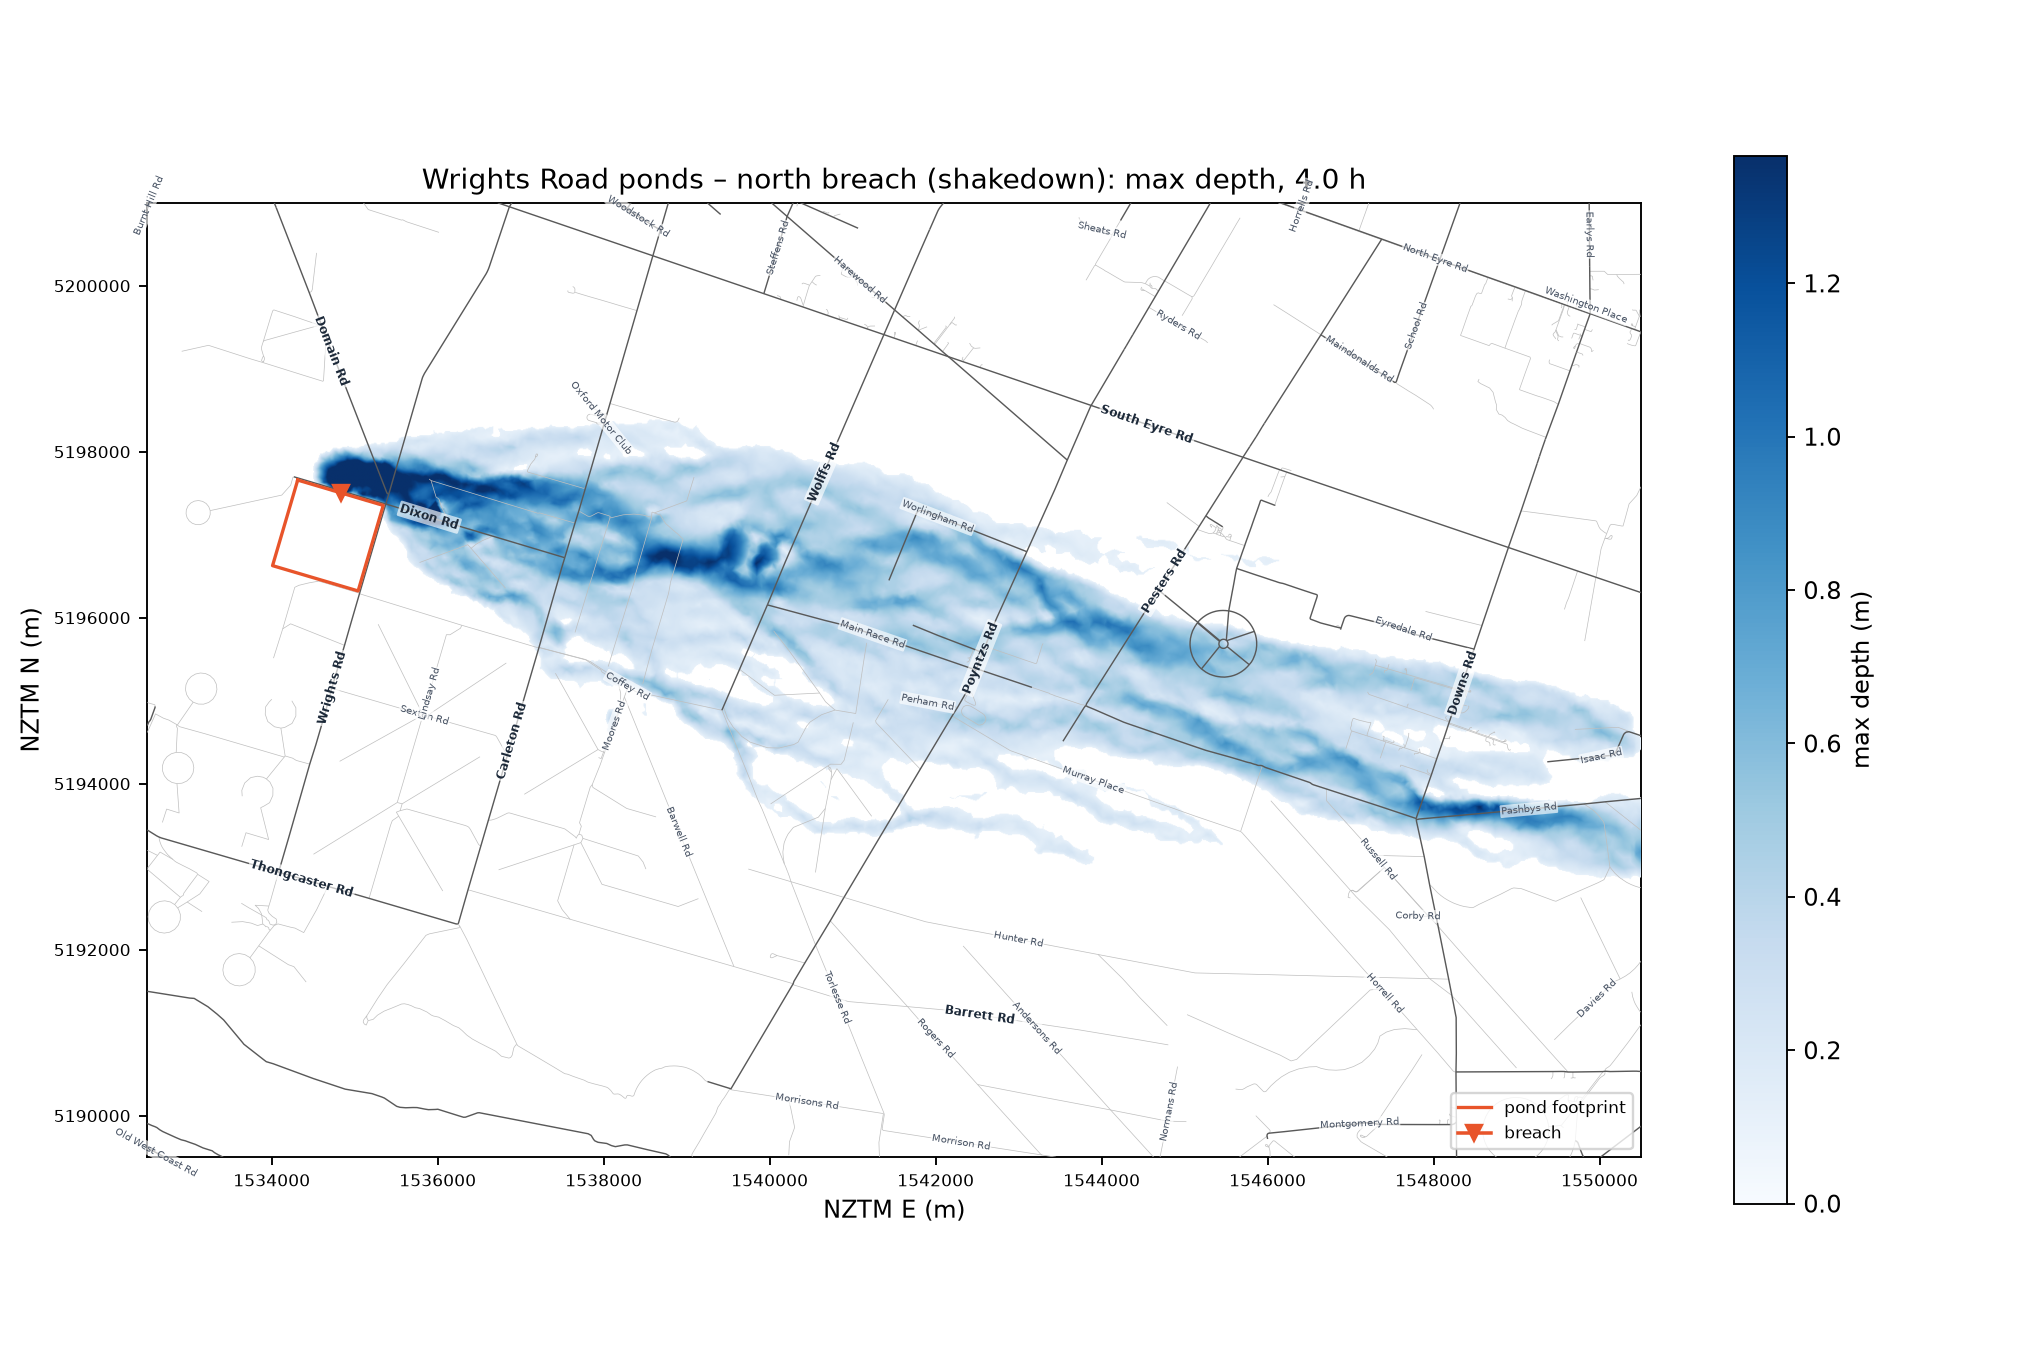
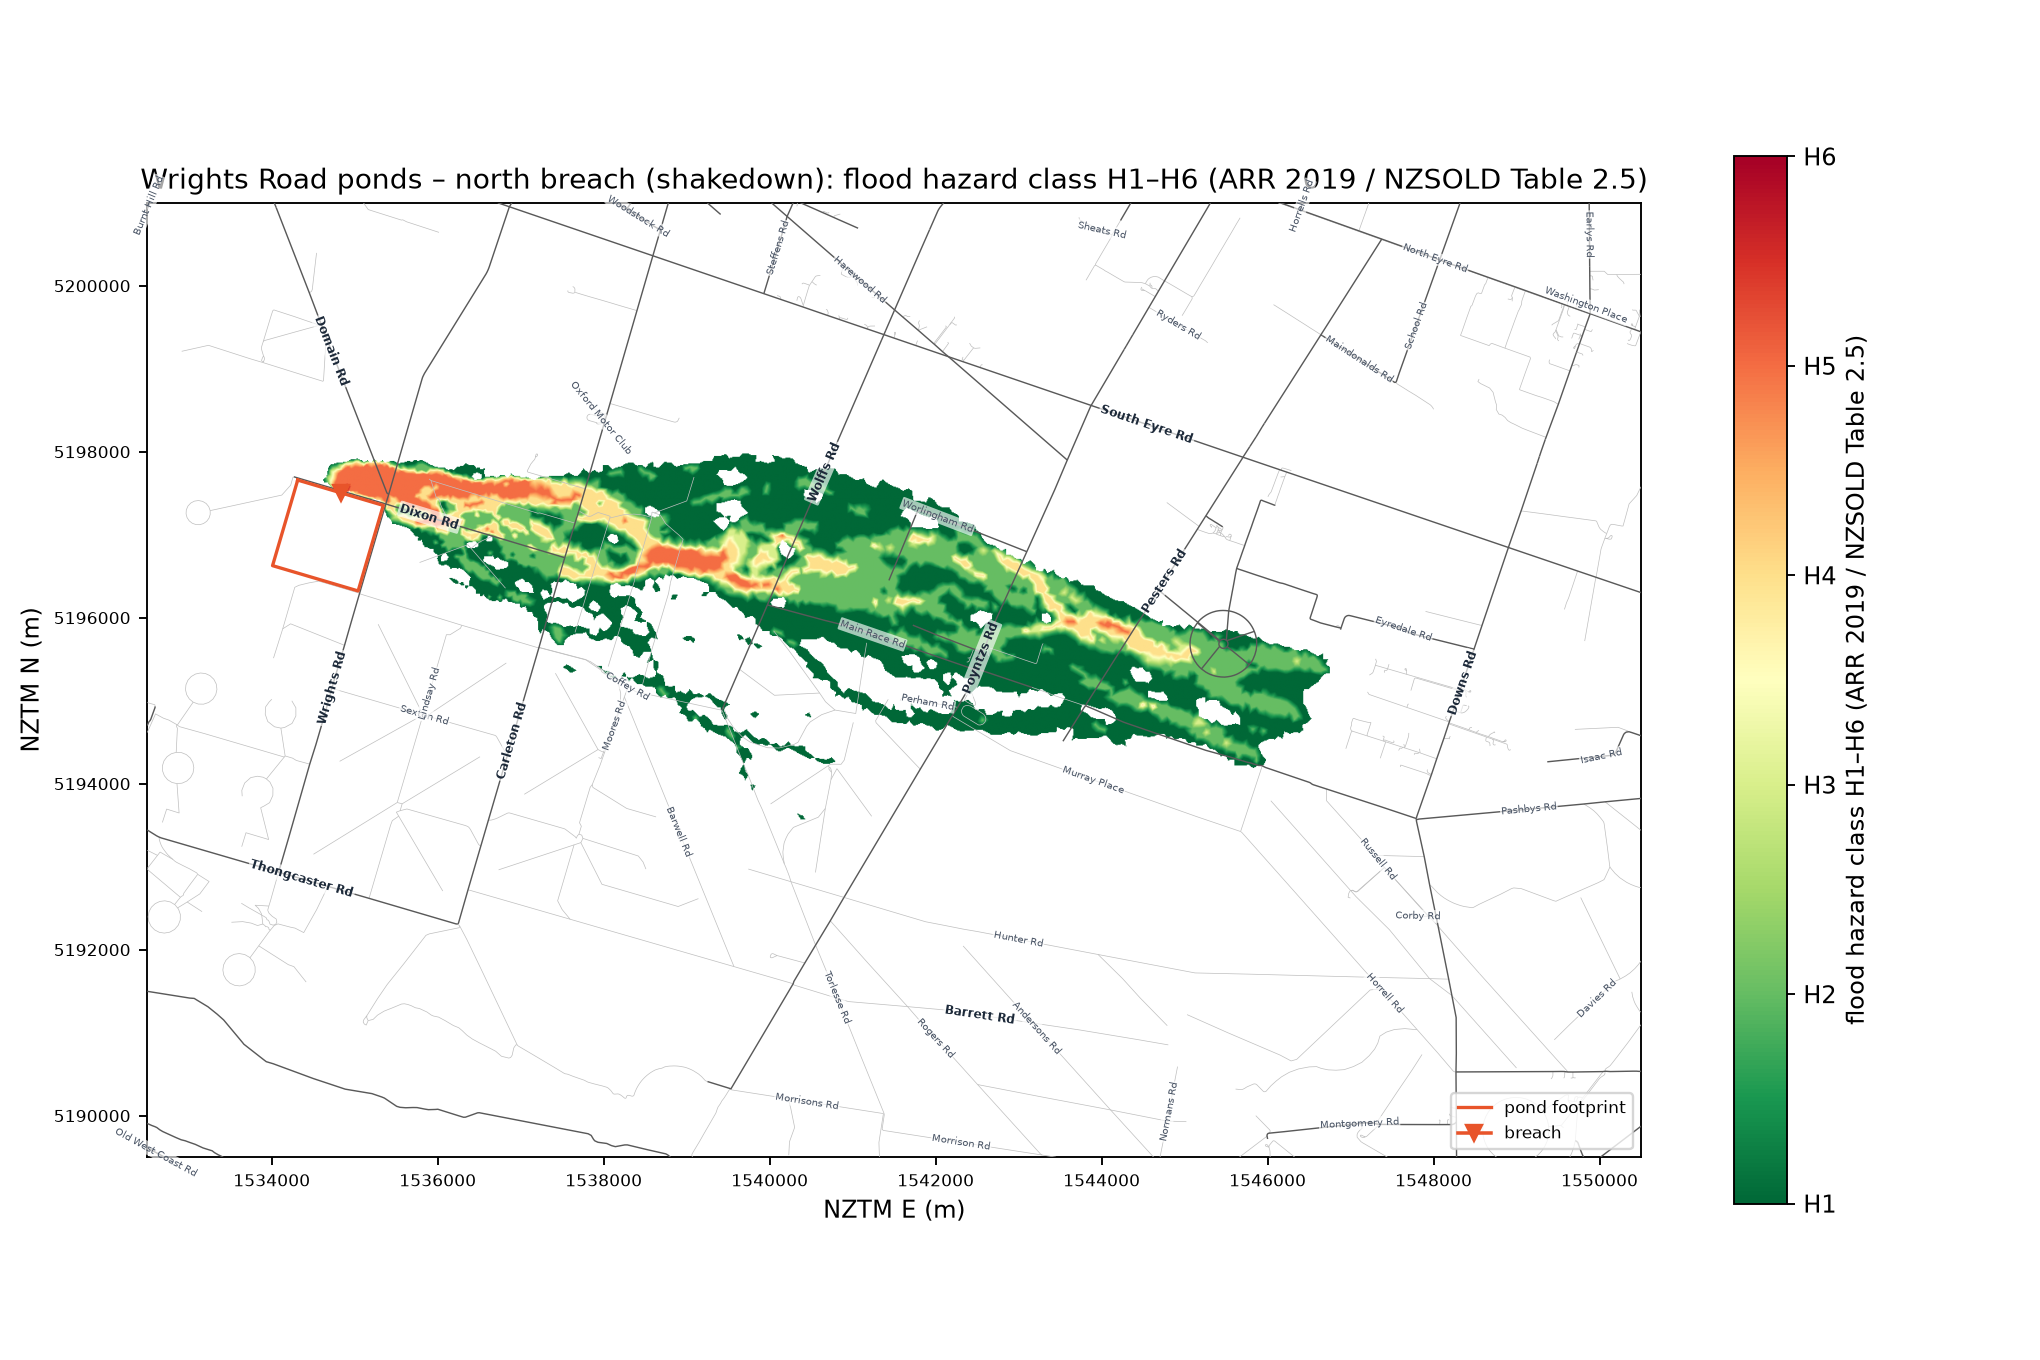
Reading: the outflow crosses Dixon Road within 20 min, turns east with the fall of the plain and runs in a band 1–3 km wide north of the east-breach corridor (between the Main Race and South Eyre Road), crosses Downs Road near Pashbys Road at 4.5 h, splits into two arms either side of Hetherton Road, and reaches Diversion Road at 9.6 h before draining to the Waimakariri River. Thongcaster and Barrett Roads stay dry. The inundated area (49 km²) is three-quarters of the Damwatch north flood zone (66 km²) and the at-risk building count (30) close to the 35 households at risk, so the extent is broadly consistent.
The arrival times are the opposite of the east case: the model is ~0.6 h later than Damwatch at Carleton
Road and the gap grows to ~4 h at Diversion Road, whereas the east run is ~0.7–1.5 h earlier than Damwatch
everywhere. Damwatch's 2016 north-breach times are the fastest in their table (Carleton Road 0:50 vs 1:30 for
the east breach) even though the north toe is 6 m higher than the east toe and the north embankment is
furthest from the corridor. In this model the north breach is a Pond 2 overtopping cascade with a 217 m
invert, which limits the head to 6.9 m and the peak to 817 m³/s (40 % of the east peak) on a gentle 1:250
plain. The 2016 study evidently assumed a much larger or faster north outflow – e.g. a breach that also
releases Pond 1 directly (FSL 226.5 m, 3.7 m higher head), a lower breach invert scoured into the foundation,
or a shorter formation time. Which pond the north embankment retains along its length and the 2016 north breach
parameters are therefore the first things to reconcile with Appendix H (assumption register A1, A4, A15 and A16 in
docs/clg-notes.md; sensitivities below); a --scour 1 --time-factor 0.5 sensitivity on the north hydrograph is the quick model-side
check. Depths at the far roads (Browns, Two Chain, Diversion) match the 2016 values within 0.1 m.
Six variants of the north hydrograph were routed on the shakedown domain to see which breach assumption
would reproduce the 2016 table (outputs/north/*_shakedown_<tag>.*, outputs/north_p1/). Times are hours
after the Pond 2 (or Pond 1) breach opens; depths are maxima at the road.
| Case | Change | Peak (m³/s) | Pond 1 failure → breach opens (h) | Carleton Rd | Wolffs Rd | Poyntzs Rd | Pesters Rd | Downs Rd | Area (km²) | Bldgs ≥ 0.5 m |
|---|---|---|---|---|---|---|---|---|---|---|
| Damwatch 2016 | – | ~2,500 quoted | ? | 0.83 h / 0.71 m | 1.17 / 0.59 | 1.58 / 0.41 | 1.83 / 0.55 | 2.50 / 0.33 | 66 (full) | 35 households |
| base | as reported above | 817 | 2.17 | 1.40 / 0.60 | 2.10 / 0.71 | 2.85 / 0.68 | 3.32 / 0.70 | not in 4 h | 20.4 | 17 |
| scour1 | invert 1 m below the toe | 997 | 2.17 | 1.28 / 0.65 | 1.94 / 0.76 | 2.67 / 0.74 | 3.10 / 0.74 | not in 4 h | 24.1 | 40 |
| fast | formation time × 0.5 | 1,090 | 1.61 | 1.00 / 0.66 | 1.57 / 0.73 | 2.29 / 0.68 | 2.73 / 0.69 | 3.91 / 0.75 | 24.8 | 31 |
| wide | breach width × 2 | 979 | 1.68 | 1.25 / 0.66 | 1.90 / 0.77 | 2.62 / 0.77 | 3.06 / 0.76 | not in 4 h | 25.2 | 51 |
| fastwide | width × 2 and time × 0.5 | 1,597 | 1.10 | 0.90 / 0.77 | 1.41 / 0.84 | 2.07 / 0.78 | 2.49 / 0.77 | 3.57 / 0.92 | 31.1 | 80 |
| full | invert at the Pond 2 floor (210.8 m), i.e. the east-size hydrograph | 2,098 | 2.17 | 0.95 / 0.88 | 1.47 / 0.96 | 2.07 / 0.97 | 2.42 / 0.92 | 3.37 / 1.16 | 39.4 | 203 |
| pond1 | Pond 1 pipes directly through the north embankment, no cascade | 473 | 0.00 | 1.25 / 0.48 | 1.98 / 0.52 | 2.87 / 0.44 | 3.45 / 0.50 | not in 4 h | 12.4 | 2 |
The full-depth case was then routed on the 12 h full domain (outputs/north/*_extended_full.*):
| Road | Damwatch 2016 north | Model, toe-level invert (base) | Model, full-depth invert |
|---|---|---|---|
| Carleton Road | 0.83 h / 0.71 m | 1.42 / 0.64 | 1.00 / 0.90 |
| Wolffs Road | 1.17 / 0.59 | 2.09 / 0.71 | 1.50 / 0.98 |
| Poyntzs Road | 1.58 / 0.41 | 2.89 / 0.69 | 2.08 / 0.99 |
| Pesters Road | 1.83 / 0.55 | 3.33 / 0.65 | 2.42 / 0.87 |
| Downs Road | 2.50 / 0.33 | 4.50 / 0.83 | 3.42 / 1.17 |
| Browns Road | 3.50 / 0.50 | 5.88 / 0.41 | 4.50 / 0.59 |
| Two Chain Road | 4.33 / 0.37 | 7.42 / 0.38 | 5.69 / 0.53 |
| Diversion Road | 5.58 / <0.1 | 9.62 / 0.32 | 7.68 / 0.44 |
| Inundated area (km²) | 66 | 49.4 | 74.3 |
| Buildings ≥ 0.5 m / PAR screening | 35 households / 95 | 30 / 75 | 201 / ~500 |
What this shows:
north_p1) is not the explanation: the Pond 1 toe on
that side is even higher (219.4 m) and the outflow smaller (473 m³/s), though it starts 2.2 h earlier because
there is no cascade.Recommendation for the certified assessment: treat the north-side breach invert (toe level vs pond floor)
as a bounding pair until drawing WIL1125/30/2 (floor levels, cut/fill on the north side) and Appendix H (2016
breach parameters) are available. For the PIC the full-depth case governs on the north side: 203 buildings
≥ 0.5 m on the 4 h domain against 17 for the toe-level breach. Assumption register: A15/A16 in
docs/clg-notes.md.
Maximum depth – full-depth north breach, 12 h full domain
Maximum depth – full-depth north breach, 4 h domain
Maximum depth (12 h, full domain)
Arrival time
Hazard class
Maximum flow speed
Depth × velocity
Time of peak depth
Shakedown domain (4 h): maximum depth, arrival time, hazard class
Maximum depth
Maximum flow speed
Depth × velocity
Hazard class H1–H6
Arrival time
Time of peak depth
Maximum depth
Maximum flow speed
Depth × velocity
Hazard class H1–H6
Arrival time
Time of peak depth
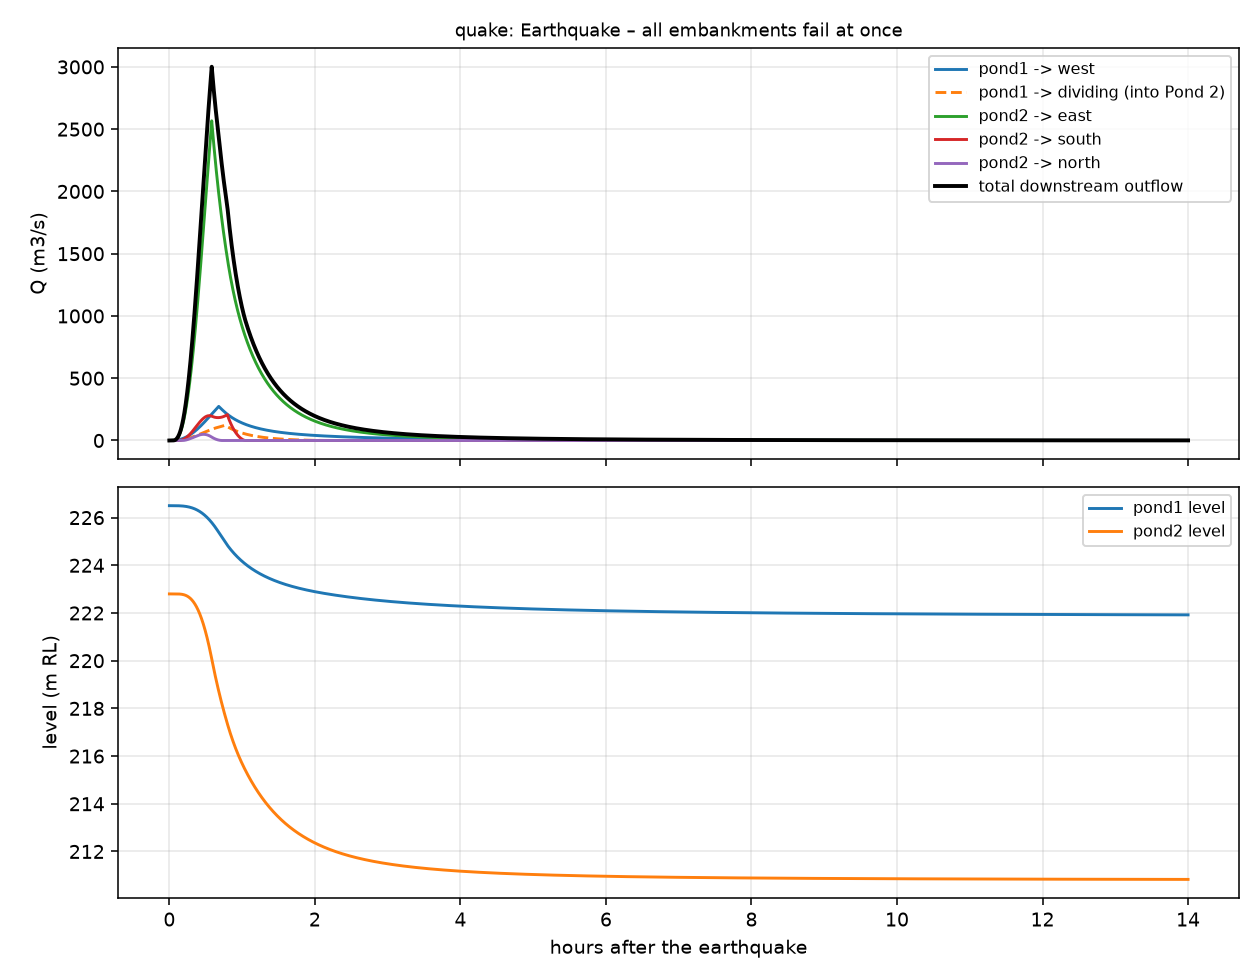
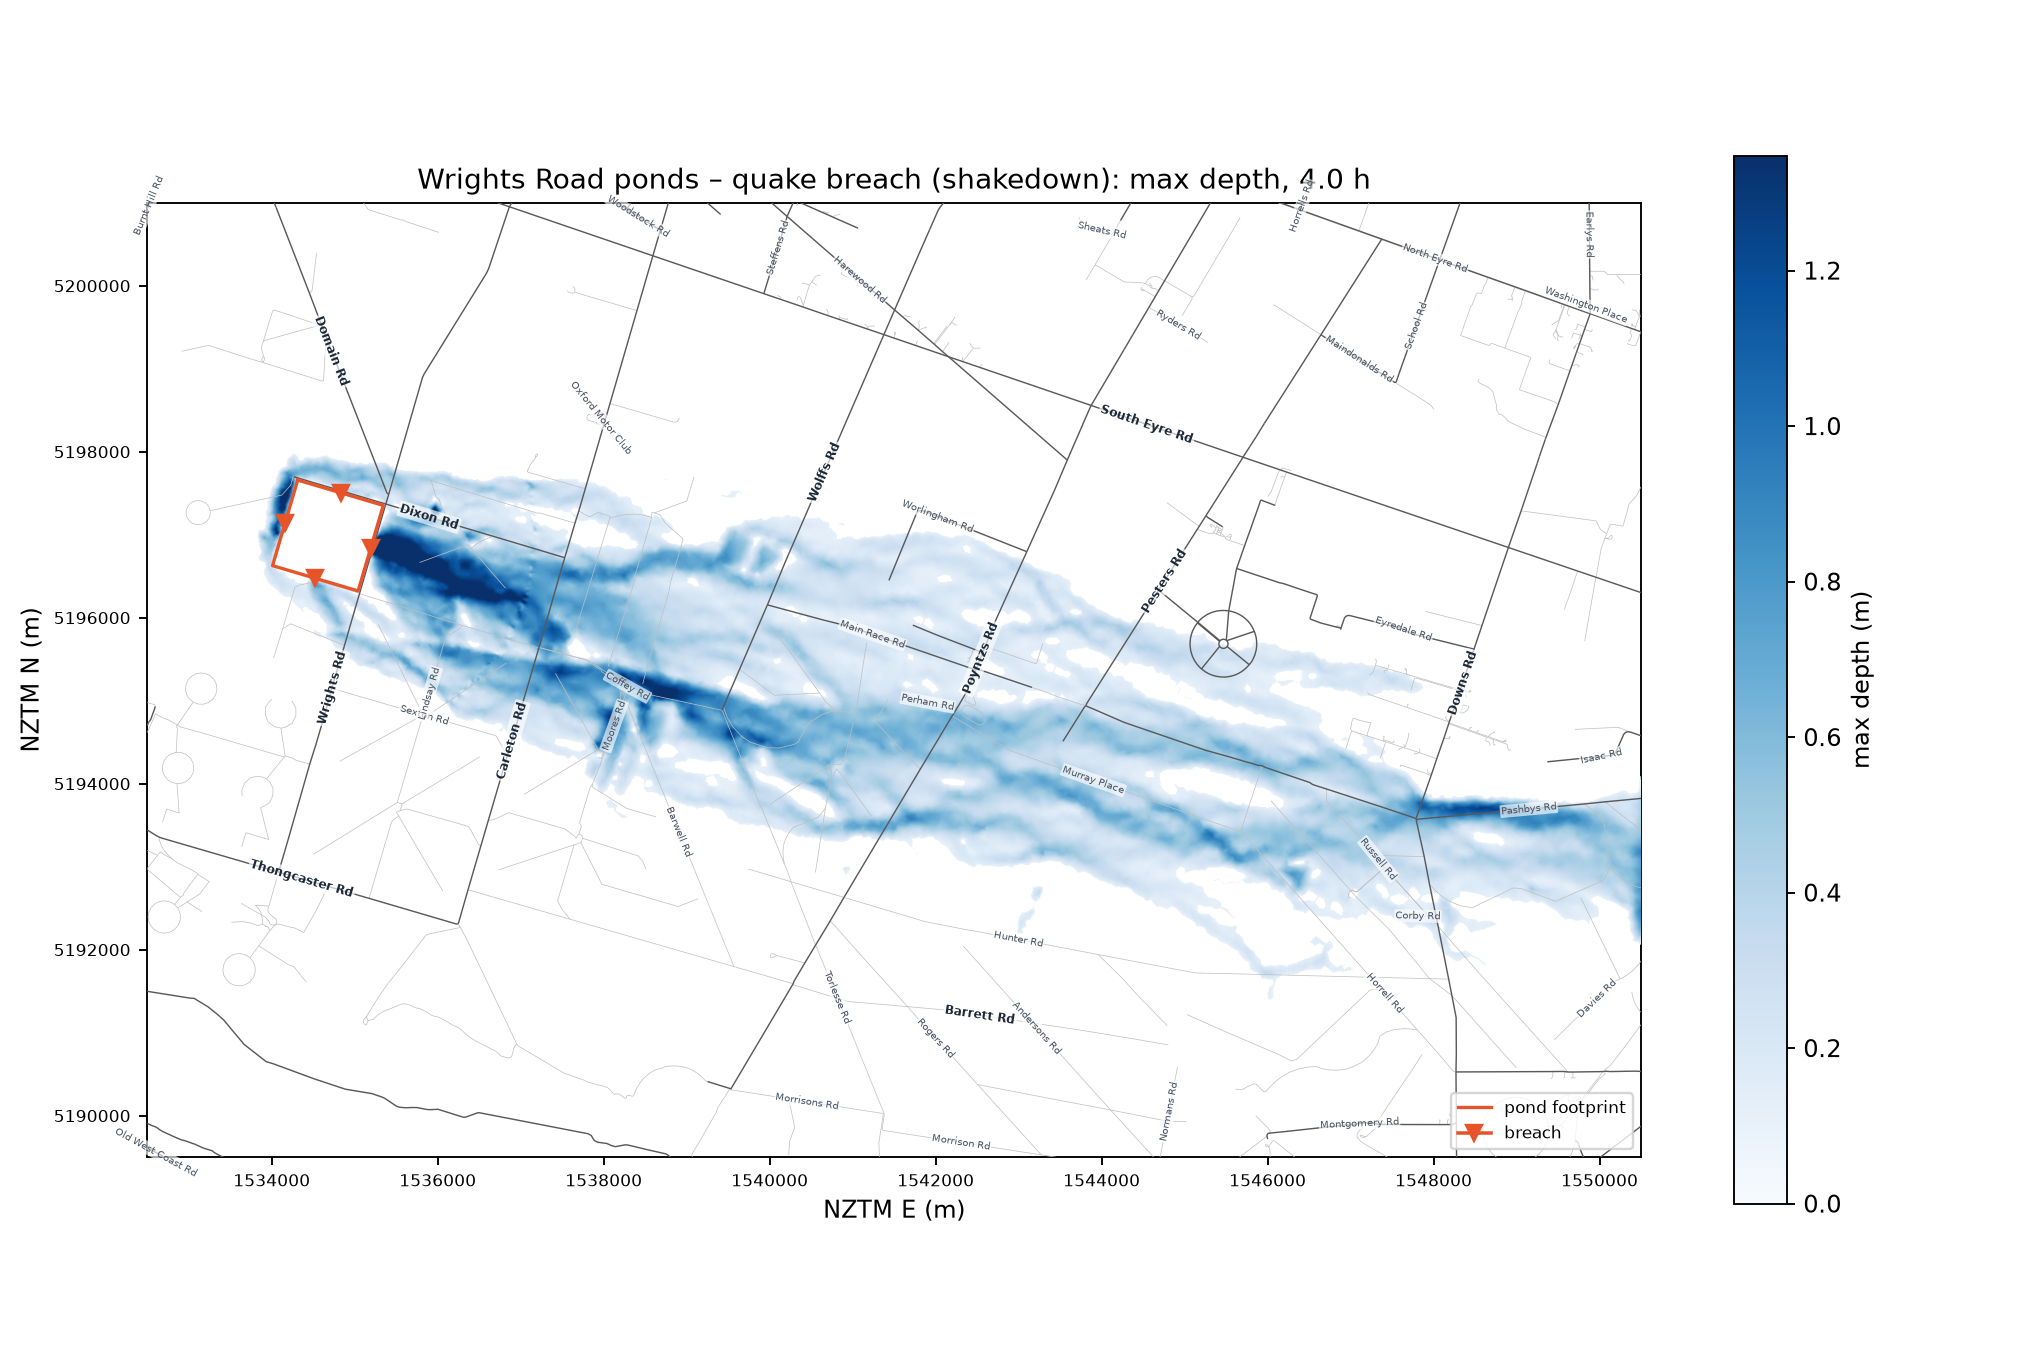
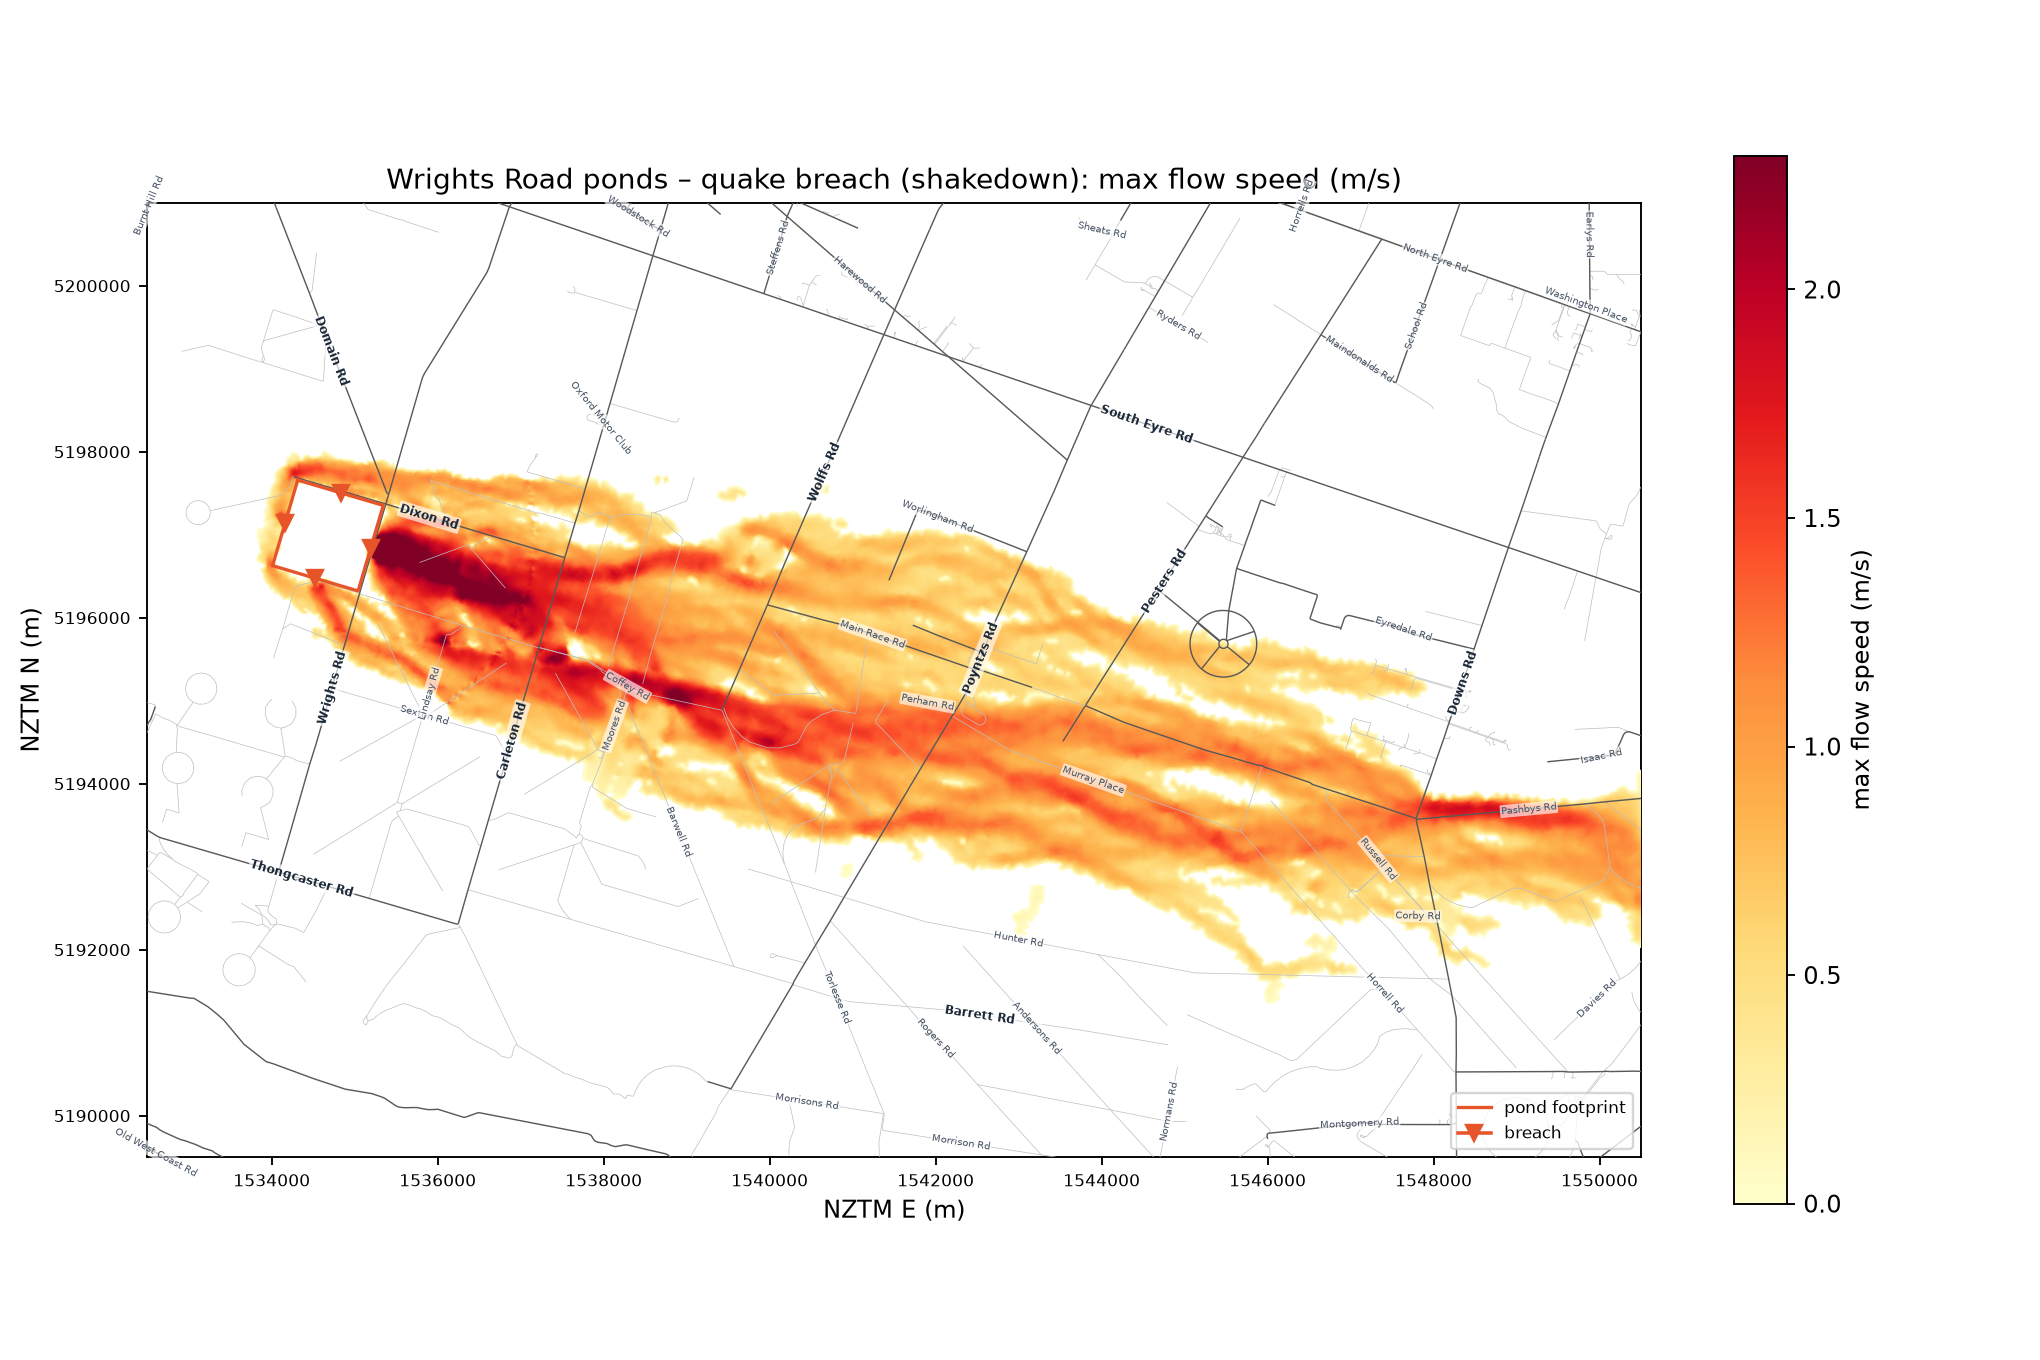
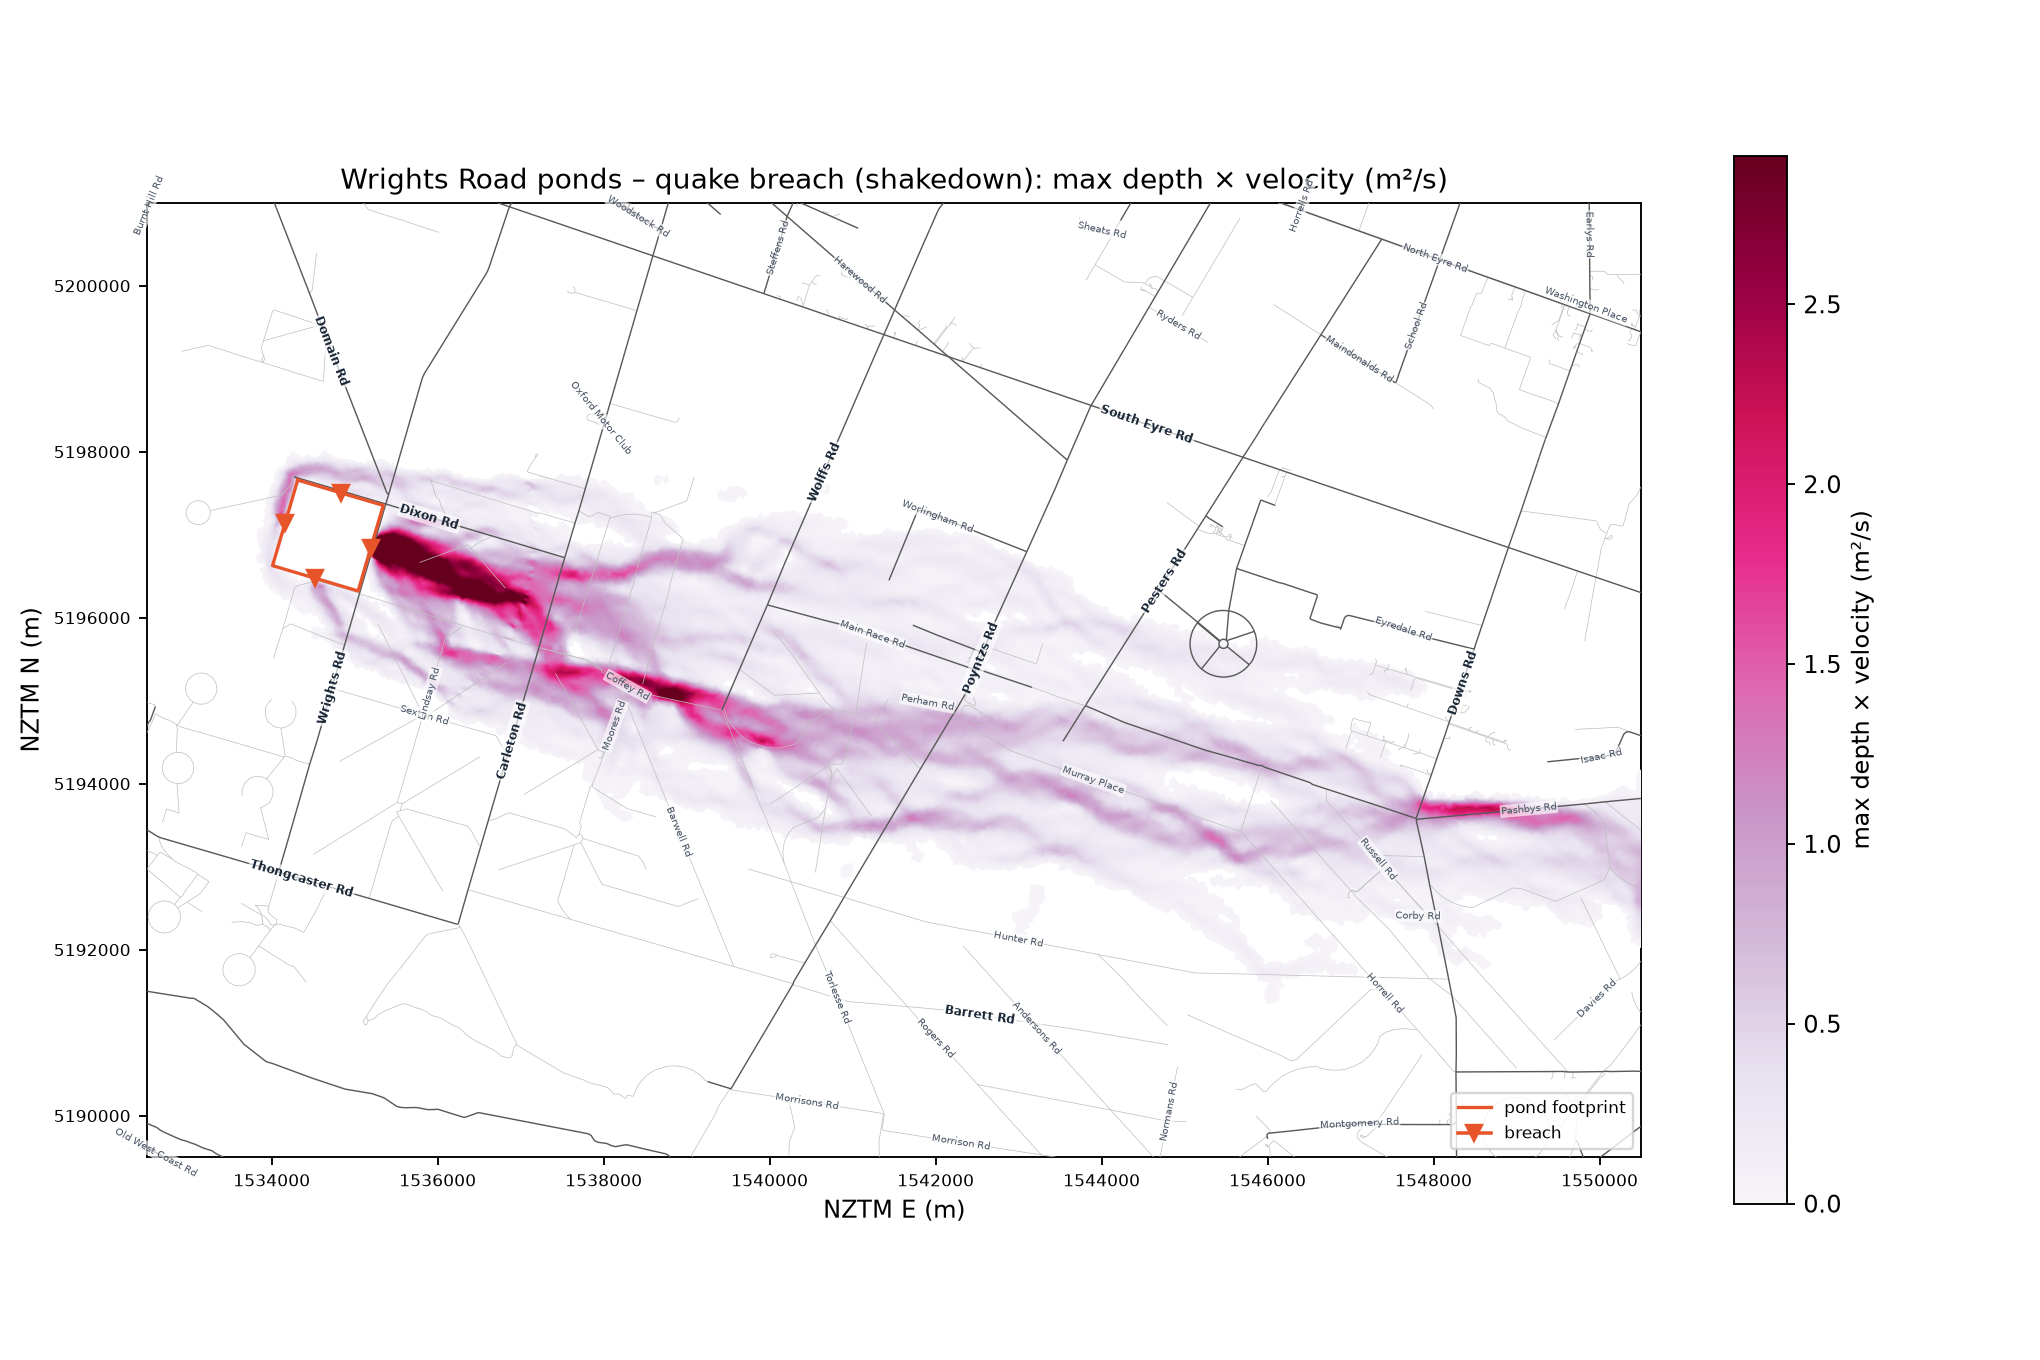
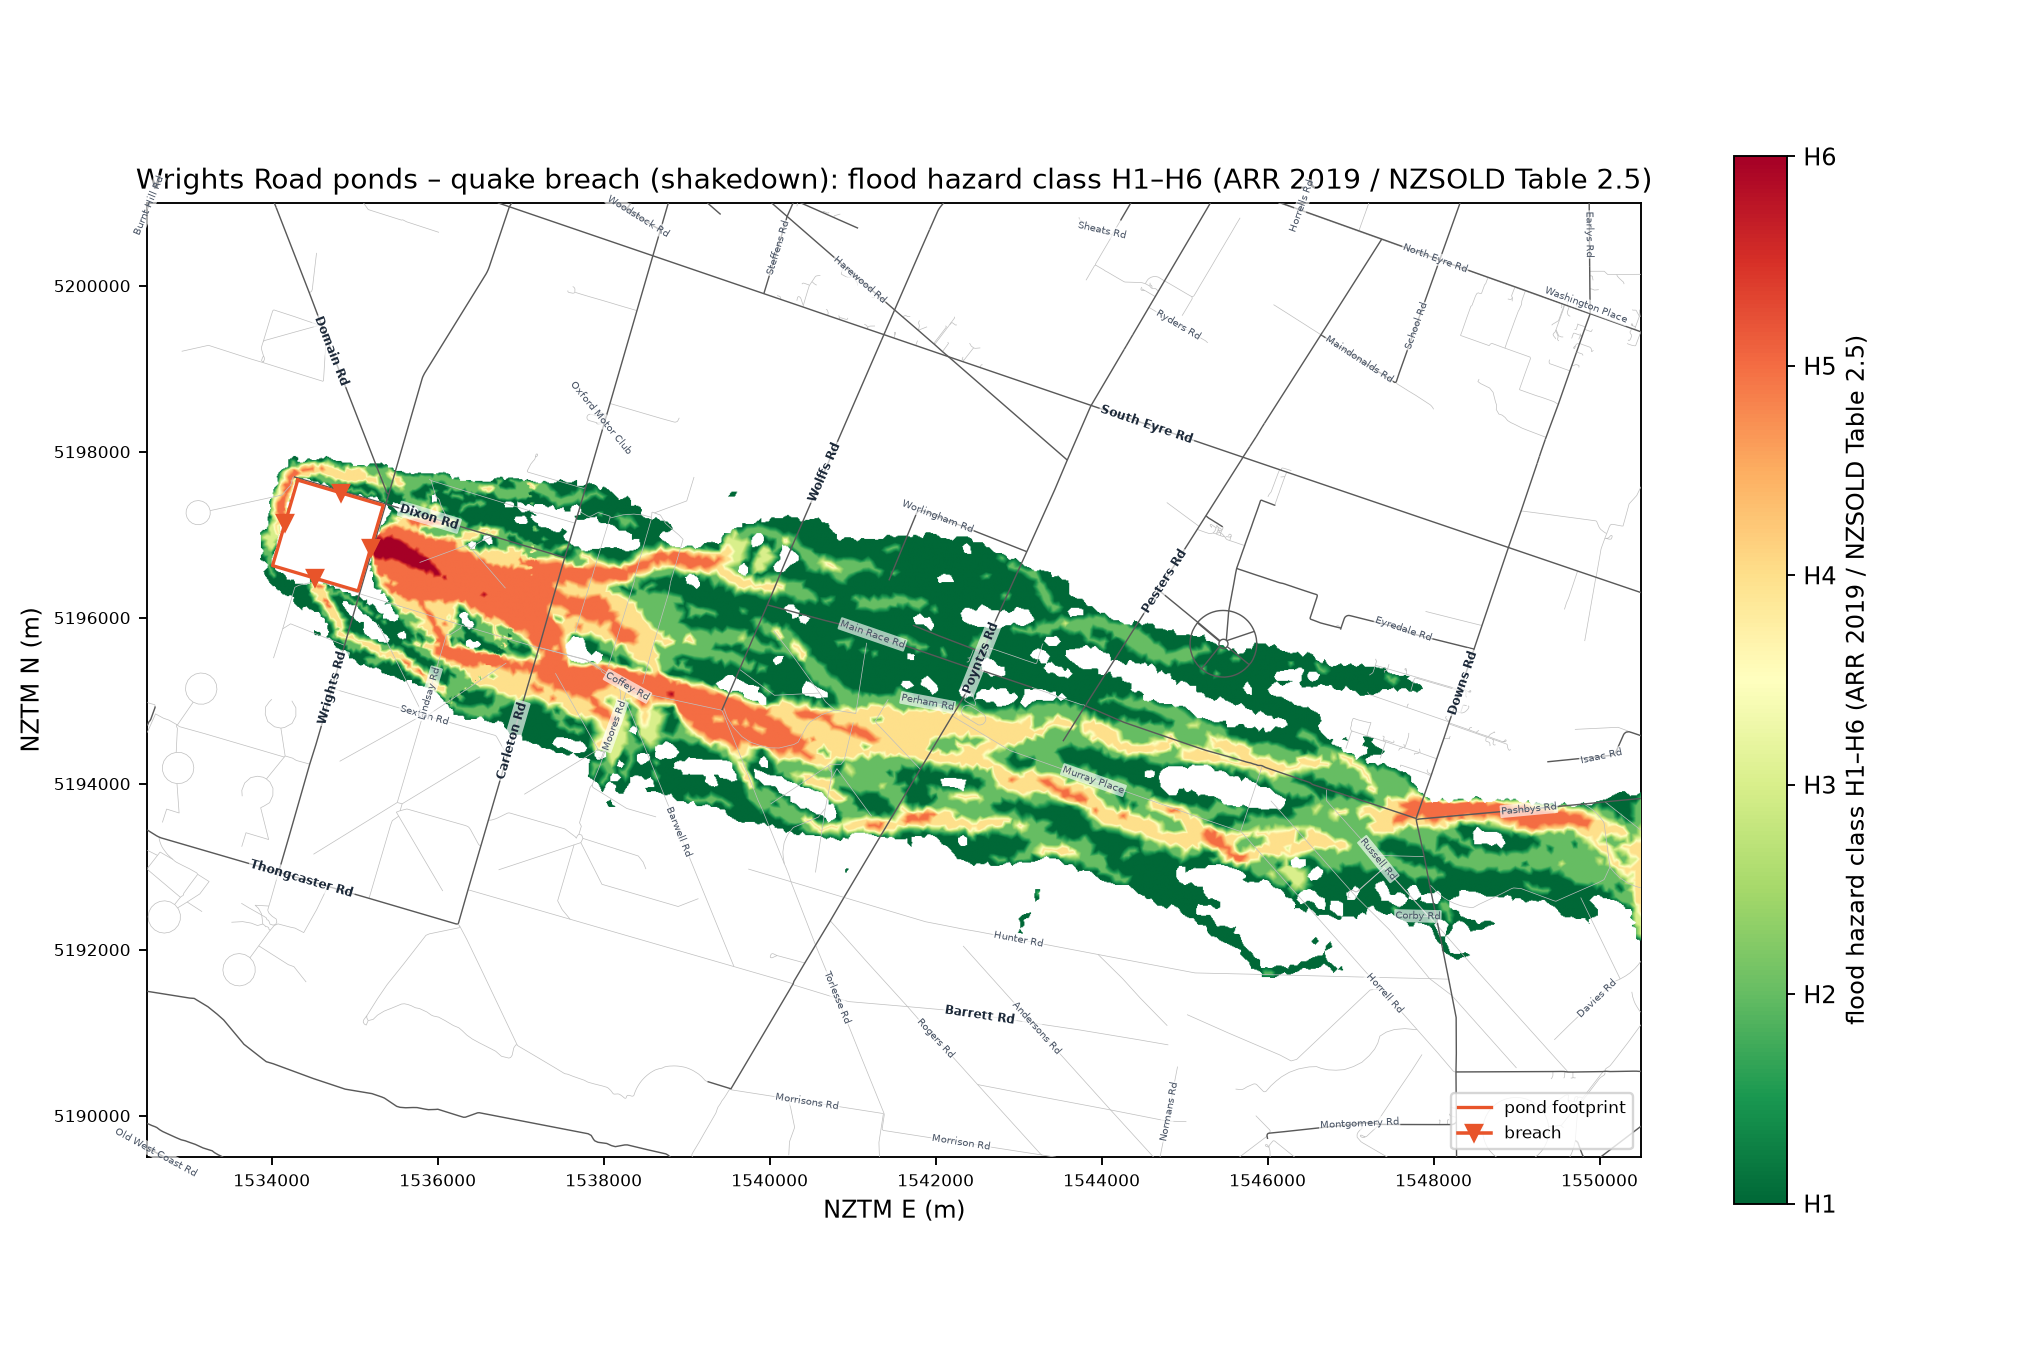
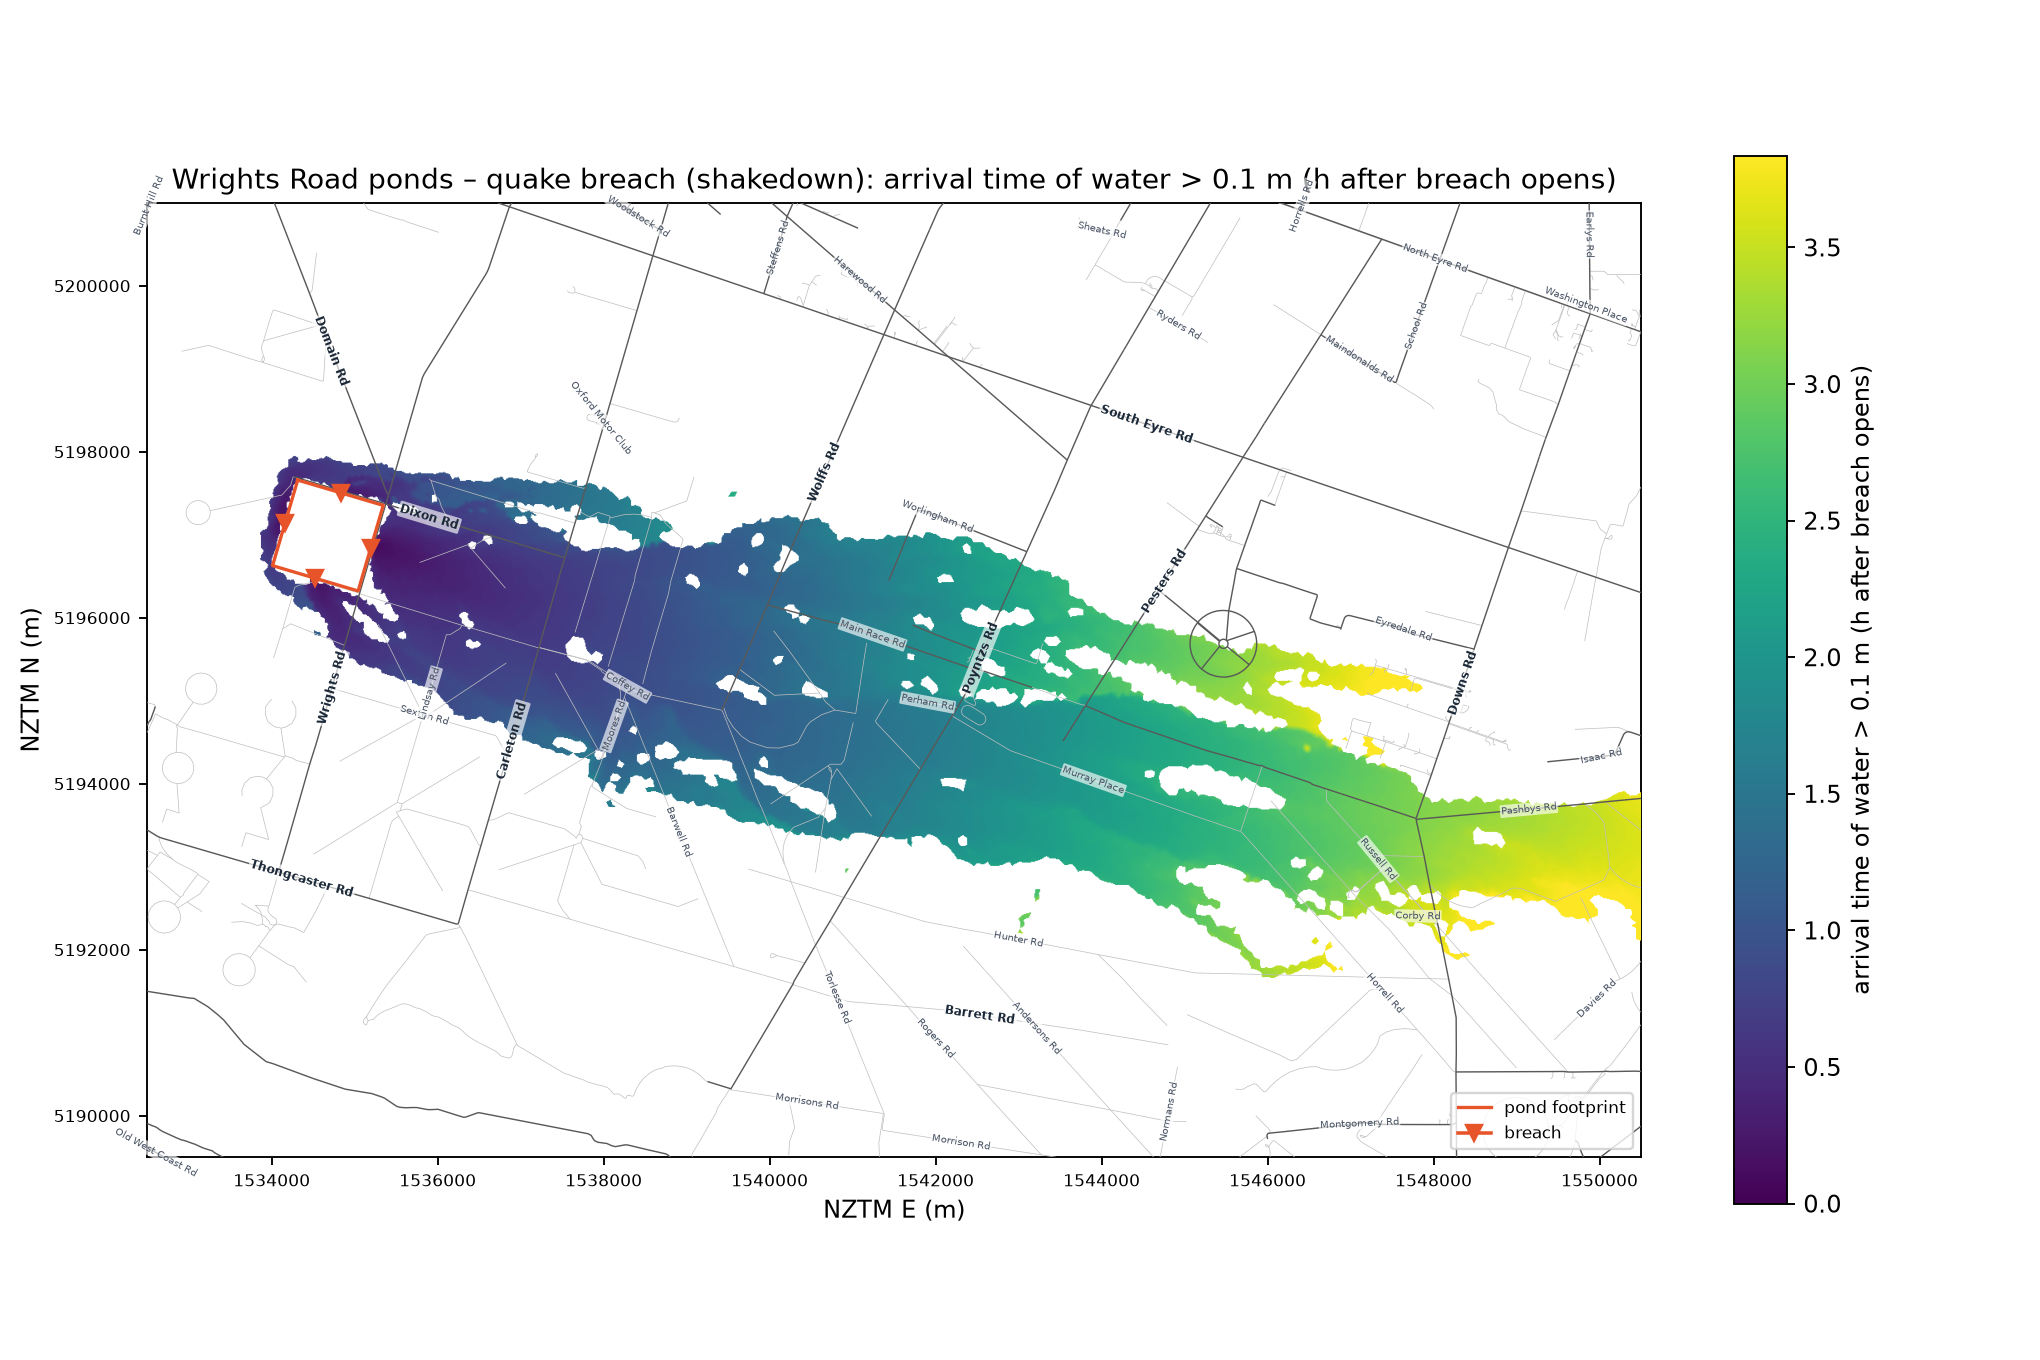
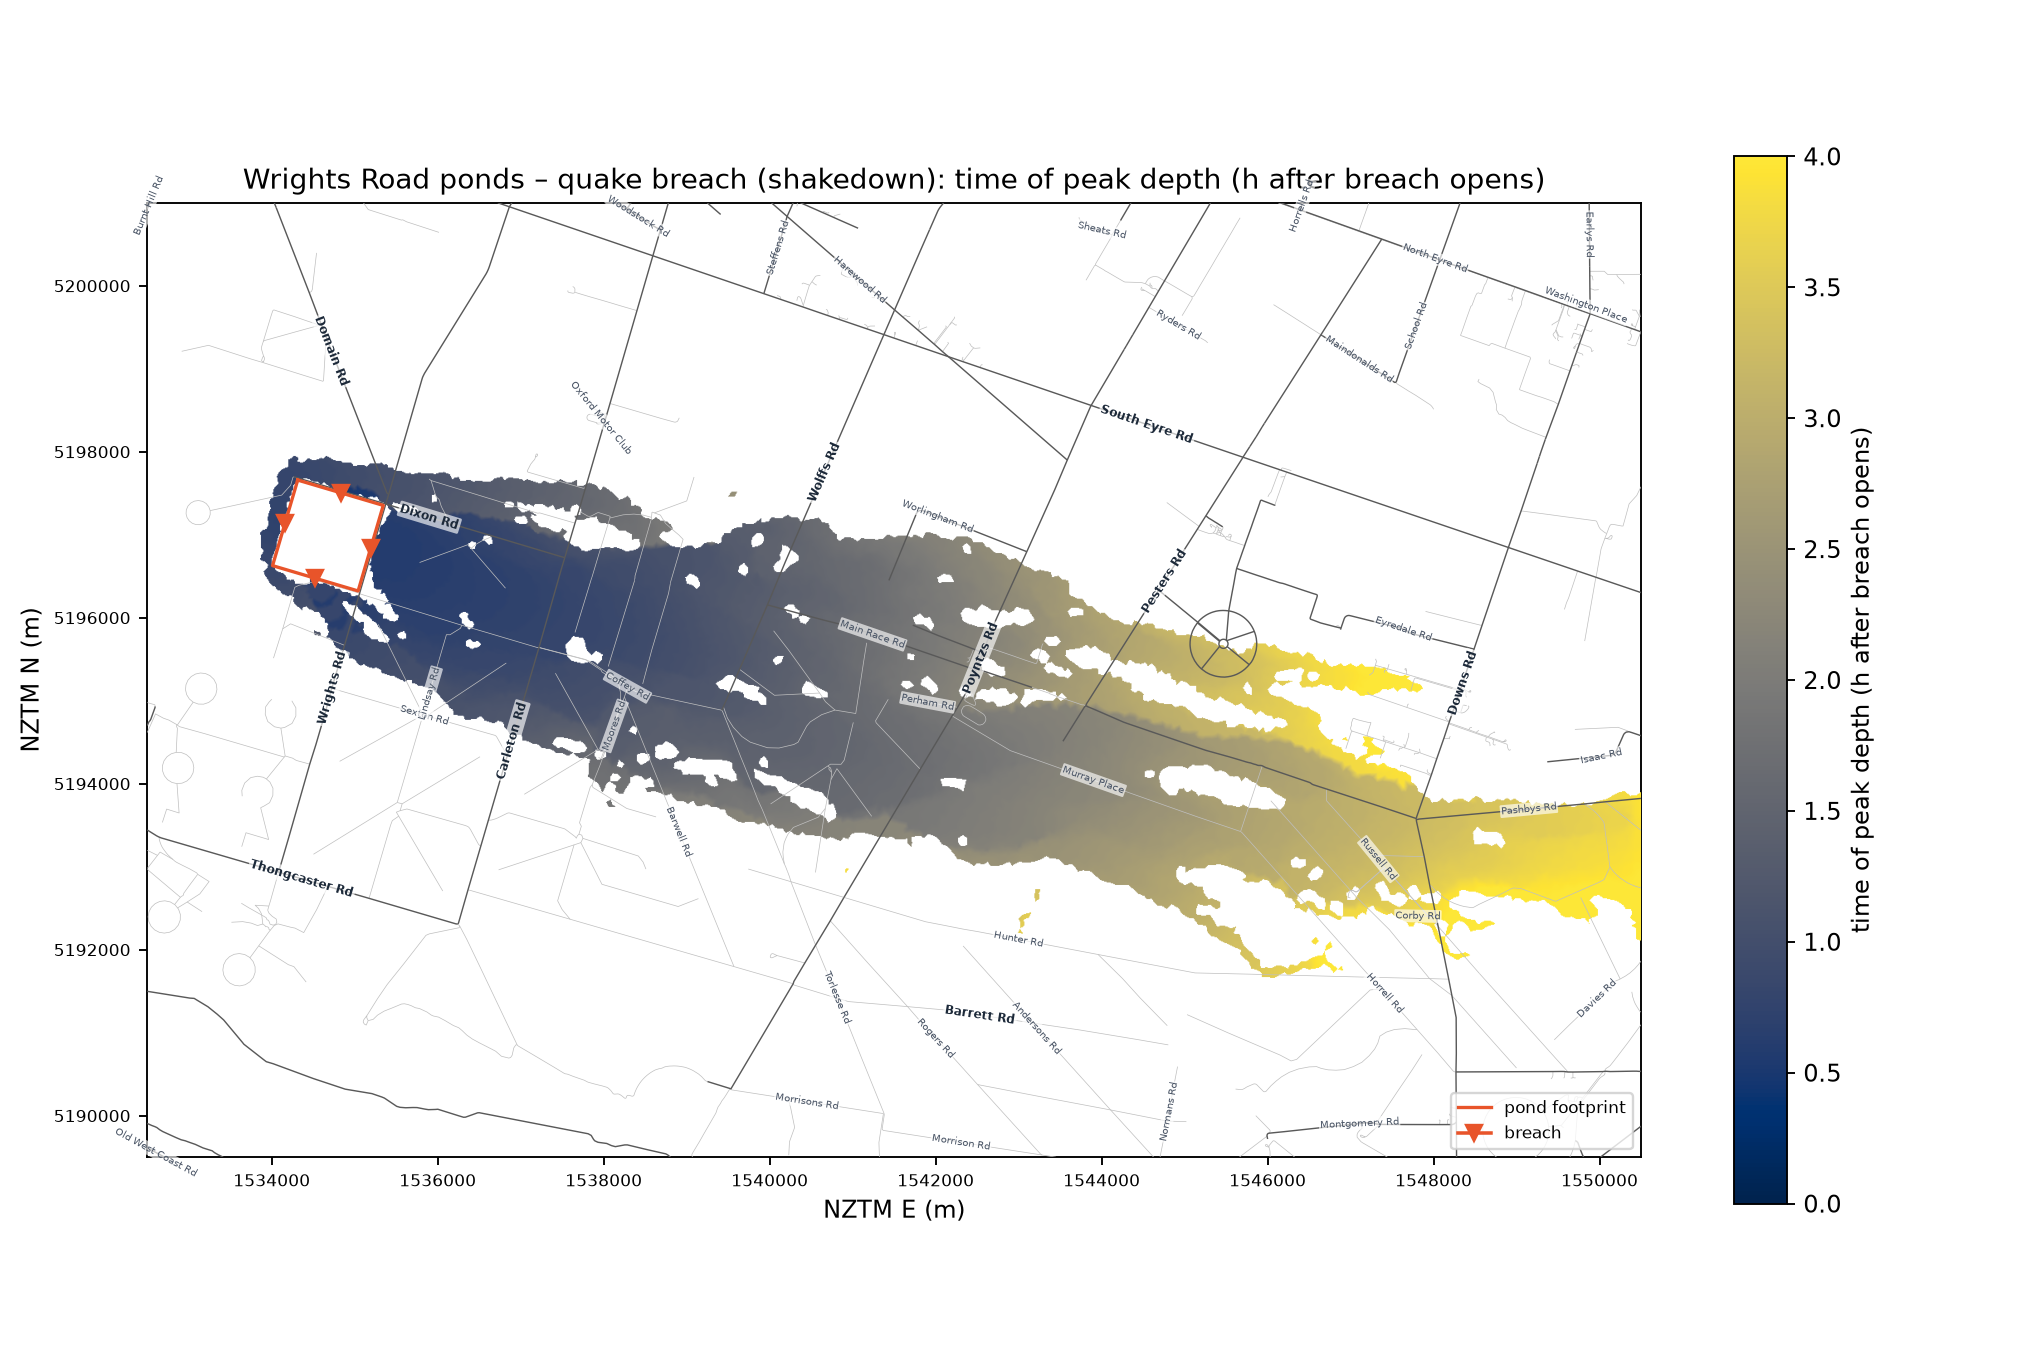
quake)Postulated seismic failure at full supply (e.g. Alpine Fault Mw ~8 or a Darfield-type Mw 7 event): the east,
south, north and west embankments and the dividing embankment all start to breach at t = 0, with Froehlich
formation times halved for erosion through cracked, slumped fill, and no warning time. Assumption list in
config/dam.yaml: scenarios.quake; method in SPEC §3.1 item 7. Time zero is the earthquake.
| Metric | Earthquake (all breaches) | East cascade (reference) |
|---|---|---|
| Combined peak outflow (m³/s) | 3,001 at 0.6 h (east breach alone 2,567; west 274; south 207; north 49) | 2,098 at 1.1 h |
| Volume released (Mm³) | 7.43 (east 6.04, west 0.97, south 0.38, north 0.05) | 7.18 |
| Lag from initiating event to external breach (h) | 0 | 2.2 (Pond 1 → Pond 2 filling) |
| Inundated area > 0.1 m after 4 h (km²) | 43.4 | 39.5 |
| Deepest water (m) | 3.1 | 2.9 |
| Fastest flow (m/s) | 5.9 | 5.5 |
| Buildings > 0.1 m / ≥ 0.5 m | 474 / 87 | 439 / 95 |
| PAR screening (2.5 persons per at-risk building) | 218 | 238 |
Road arrival (h after the initiating event, water > 0.1 m) and maximum depth:
| Road | Earthquake arrival | East cascade arrival (after Pond 2 breach) | East cascade arrival (after Pond 1 failure) | Quake depth (m) | East depth (m) |
|---|---|---|---|---|---|
| Carleton Road | 0.60 | 0.77 | 2.94 | 1.04 | 1.00 |
| Wolffs Road | 1.07 | 1.33 | 3.50 | 0.90 | 0.94 |
| Poyntzs Road | 1.60 | 1.90 | 4.07 | 0.72 | 0.75 |
| Pesters Road | 1.98 | 2.27 | 4.44 | 0.48 | 0.51 |
| Downs Road | 3.10 | 3.33 | 5.50 | 1.11 | 1.18 |
| Dixon Road (north) | 0.29 | – | – | 0.76 | – |
| Domain Road (north) | 0.49 | – | – | 0.51 | – |
Reading: the east breach still carries 80 % of the water because its invert is 5–6 m lower than the others, so the downstream picture along Carleton–Downs Road resembles the east cascade, arriving 10–20 min sooner and, measured from the initiating event, about 2.3 h sooner because there is no Pond 1 → Pond 2 stage. The extra 4 km² of inundation and the additional buildings reached are on the Dixon Road (north), MR4 (west) and R2 race (south) sides, which the single-breach scenarios do not touch. The number of buildings ≥ 0.5 m is slightly lower than the east case because the same volume is spread over more directions.
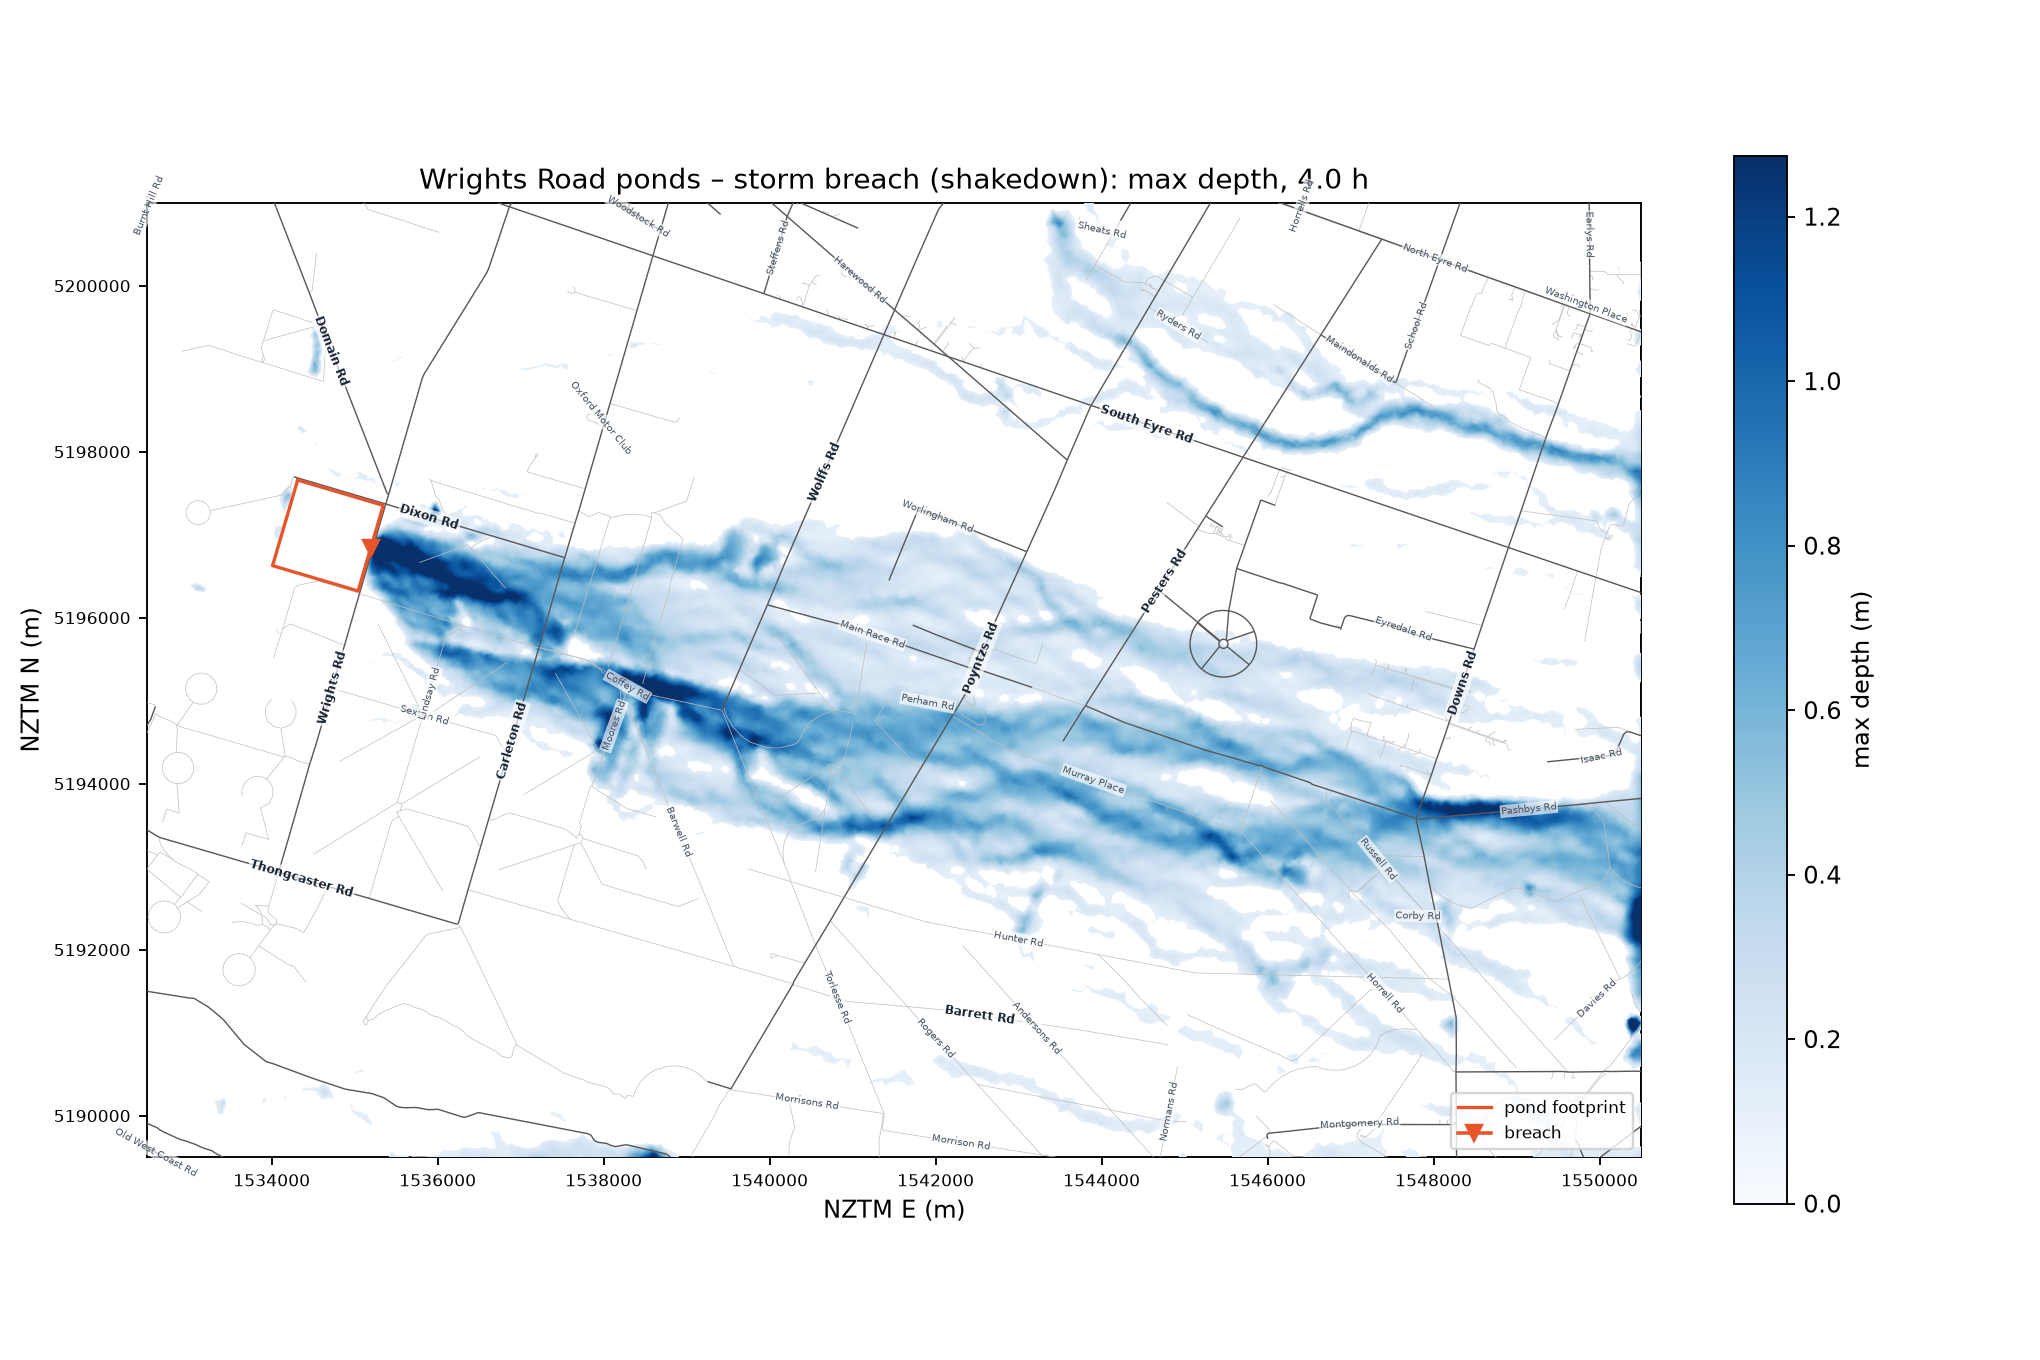
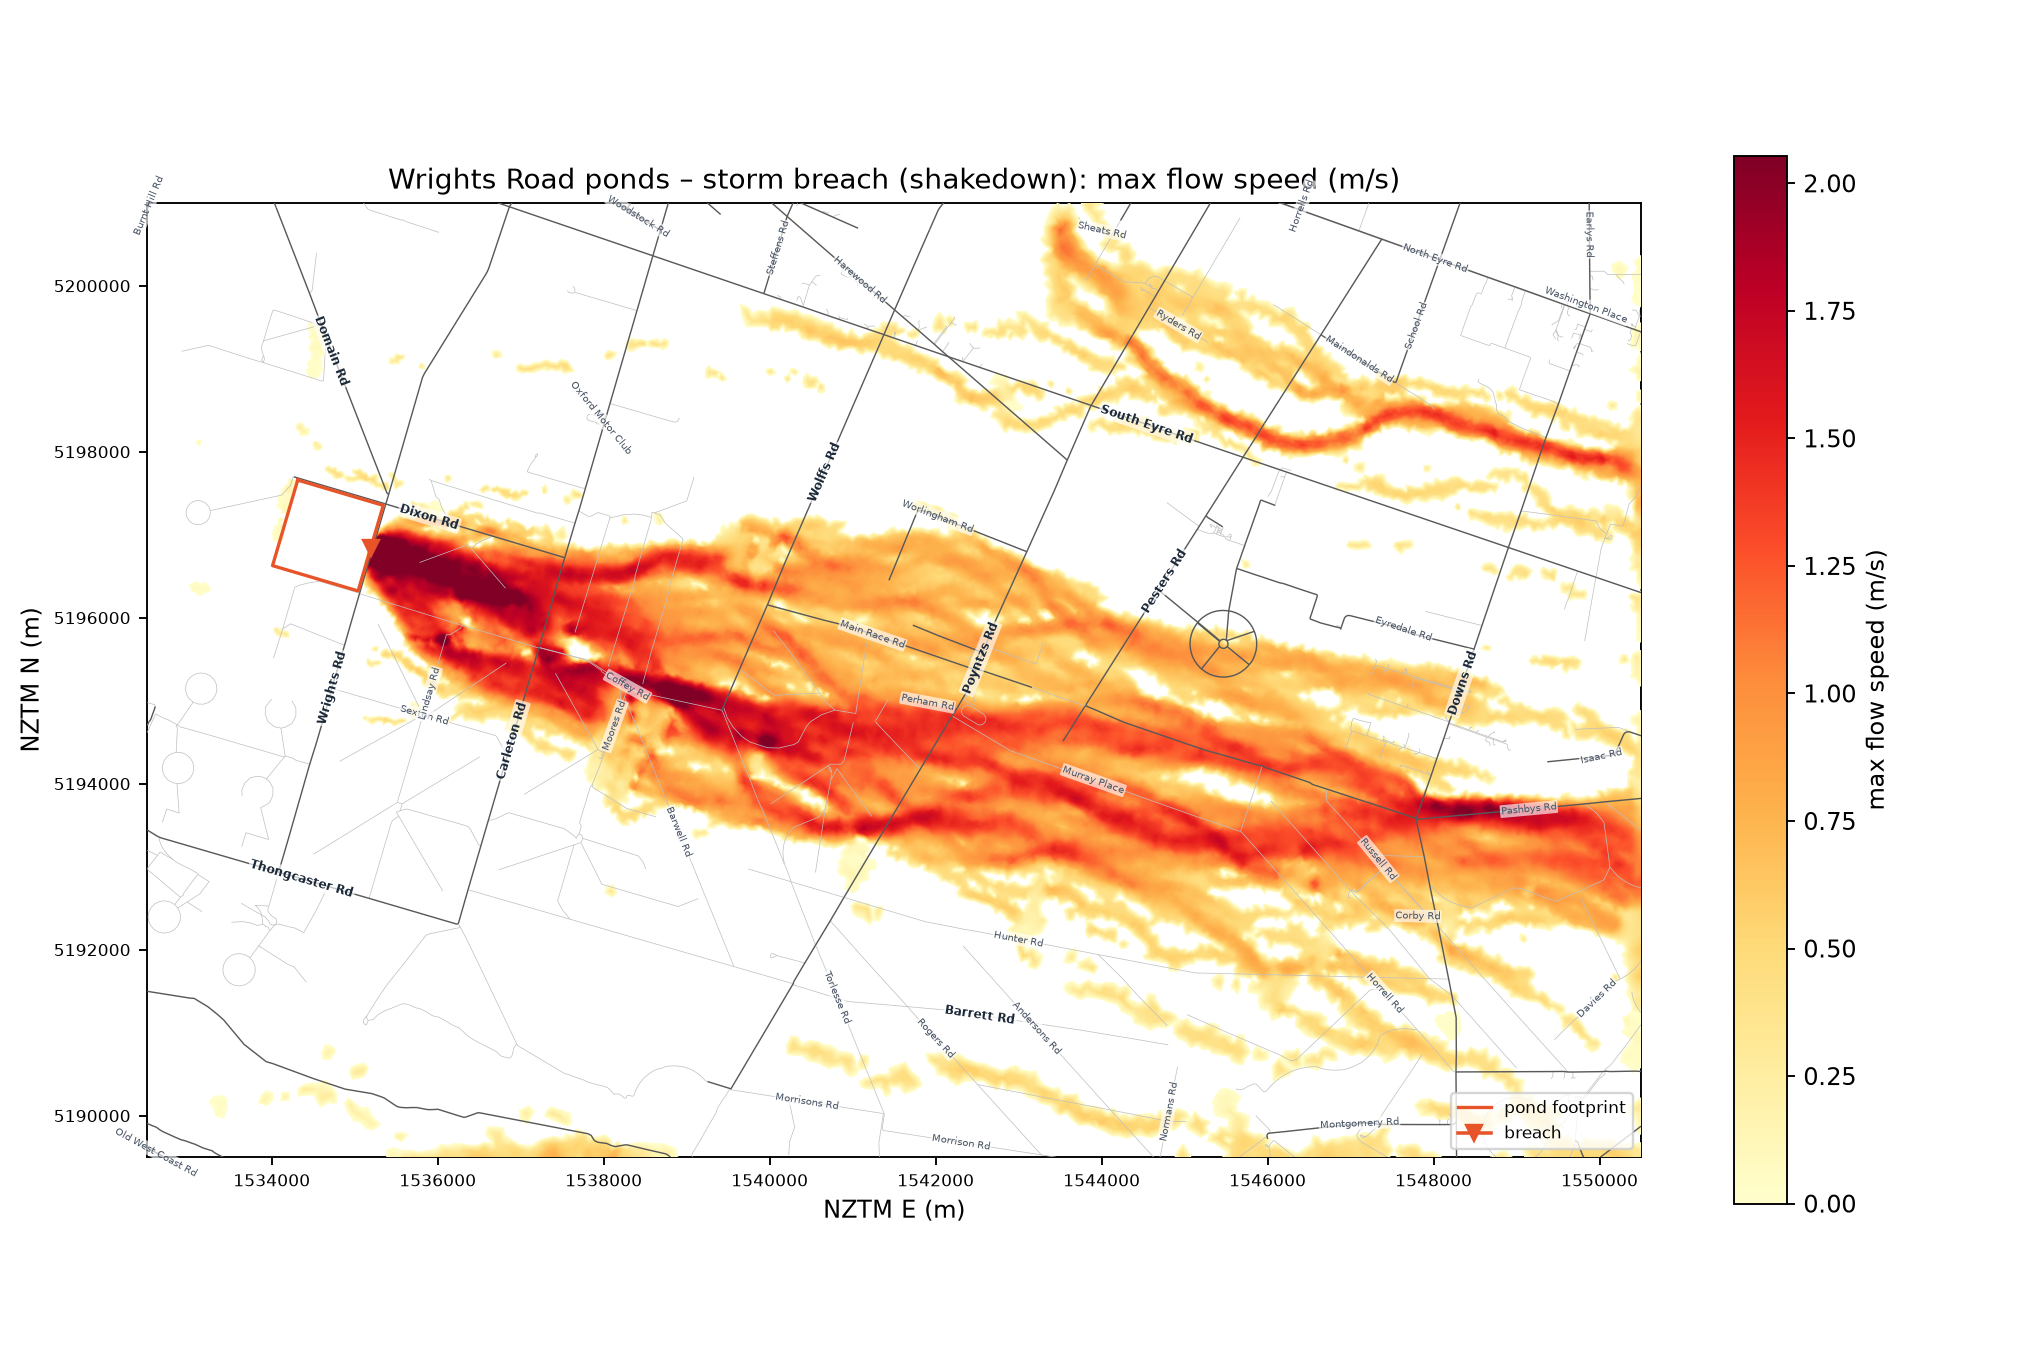
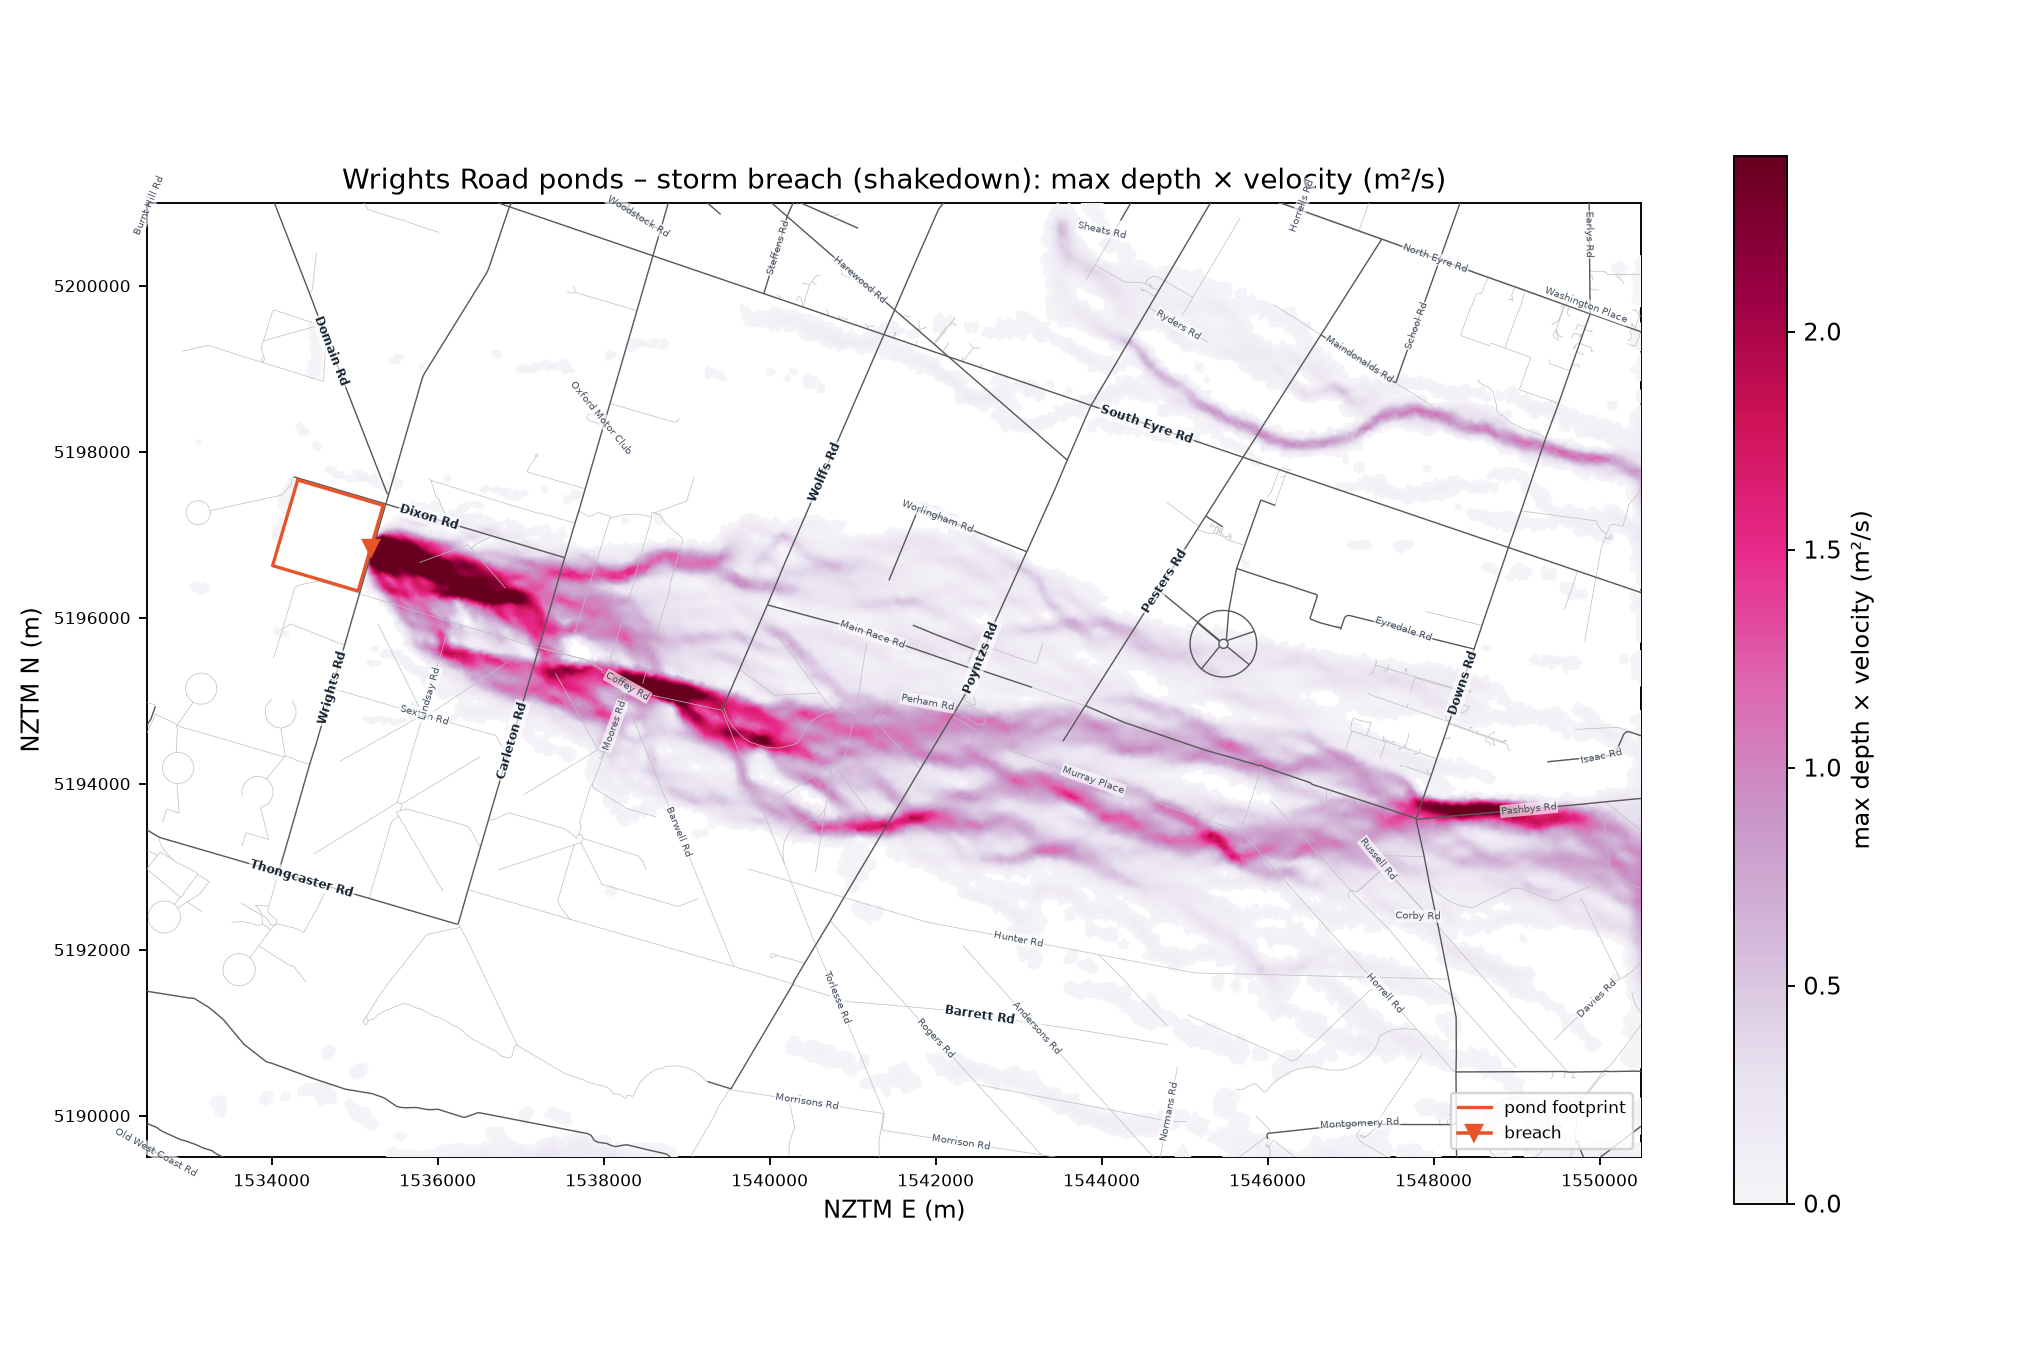
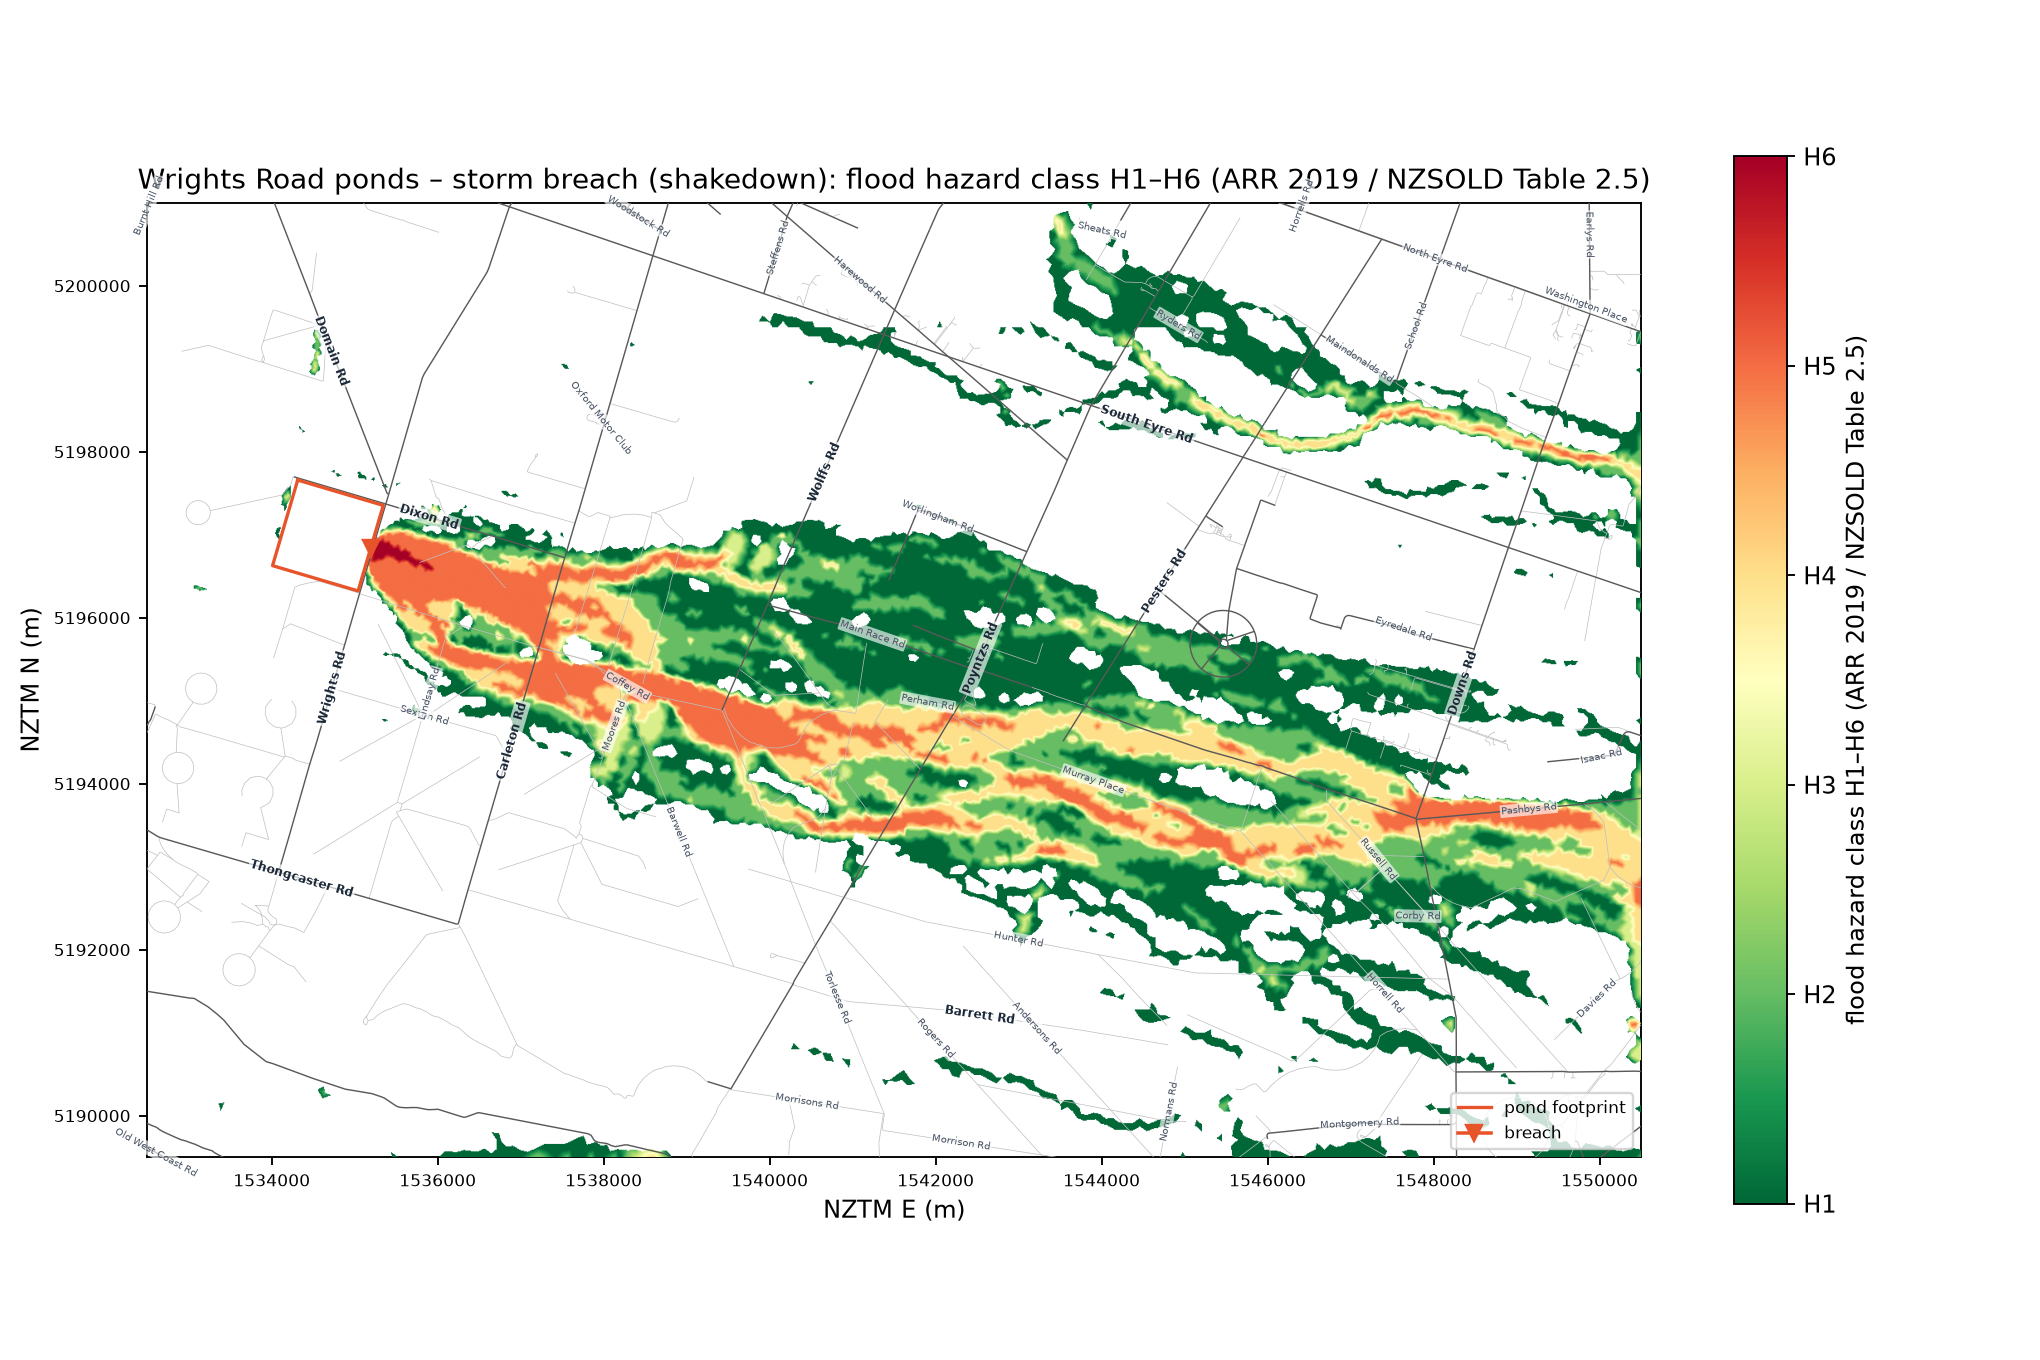
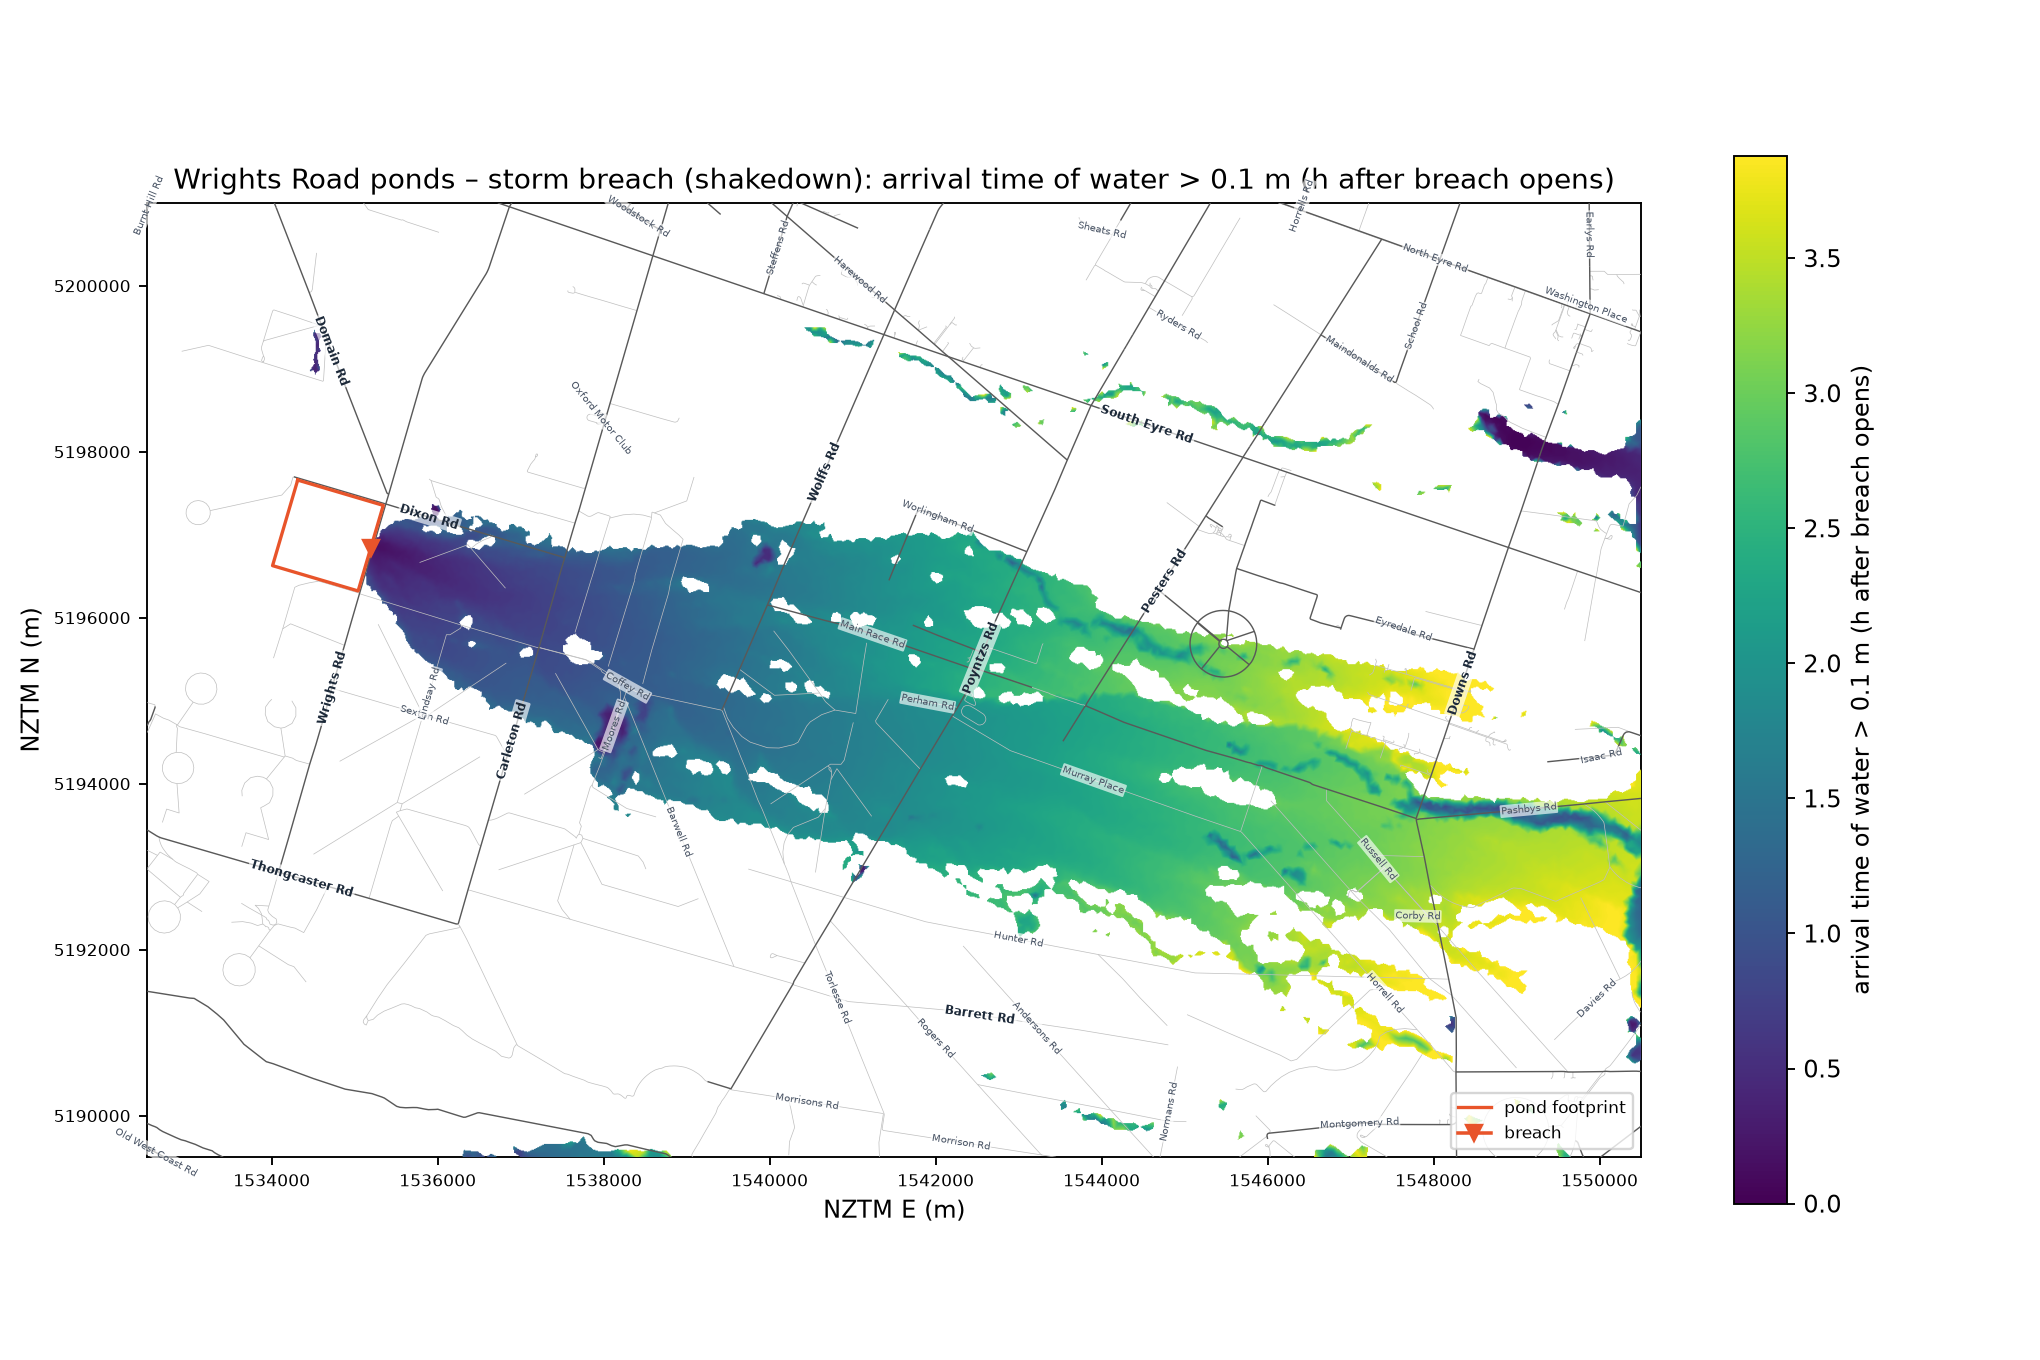
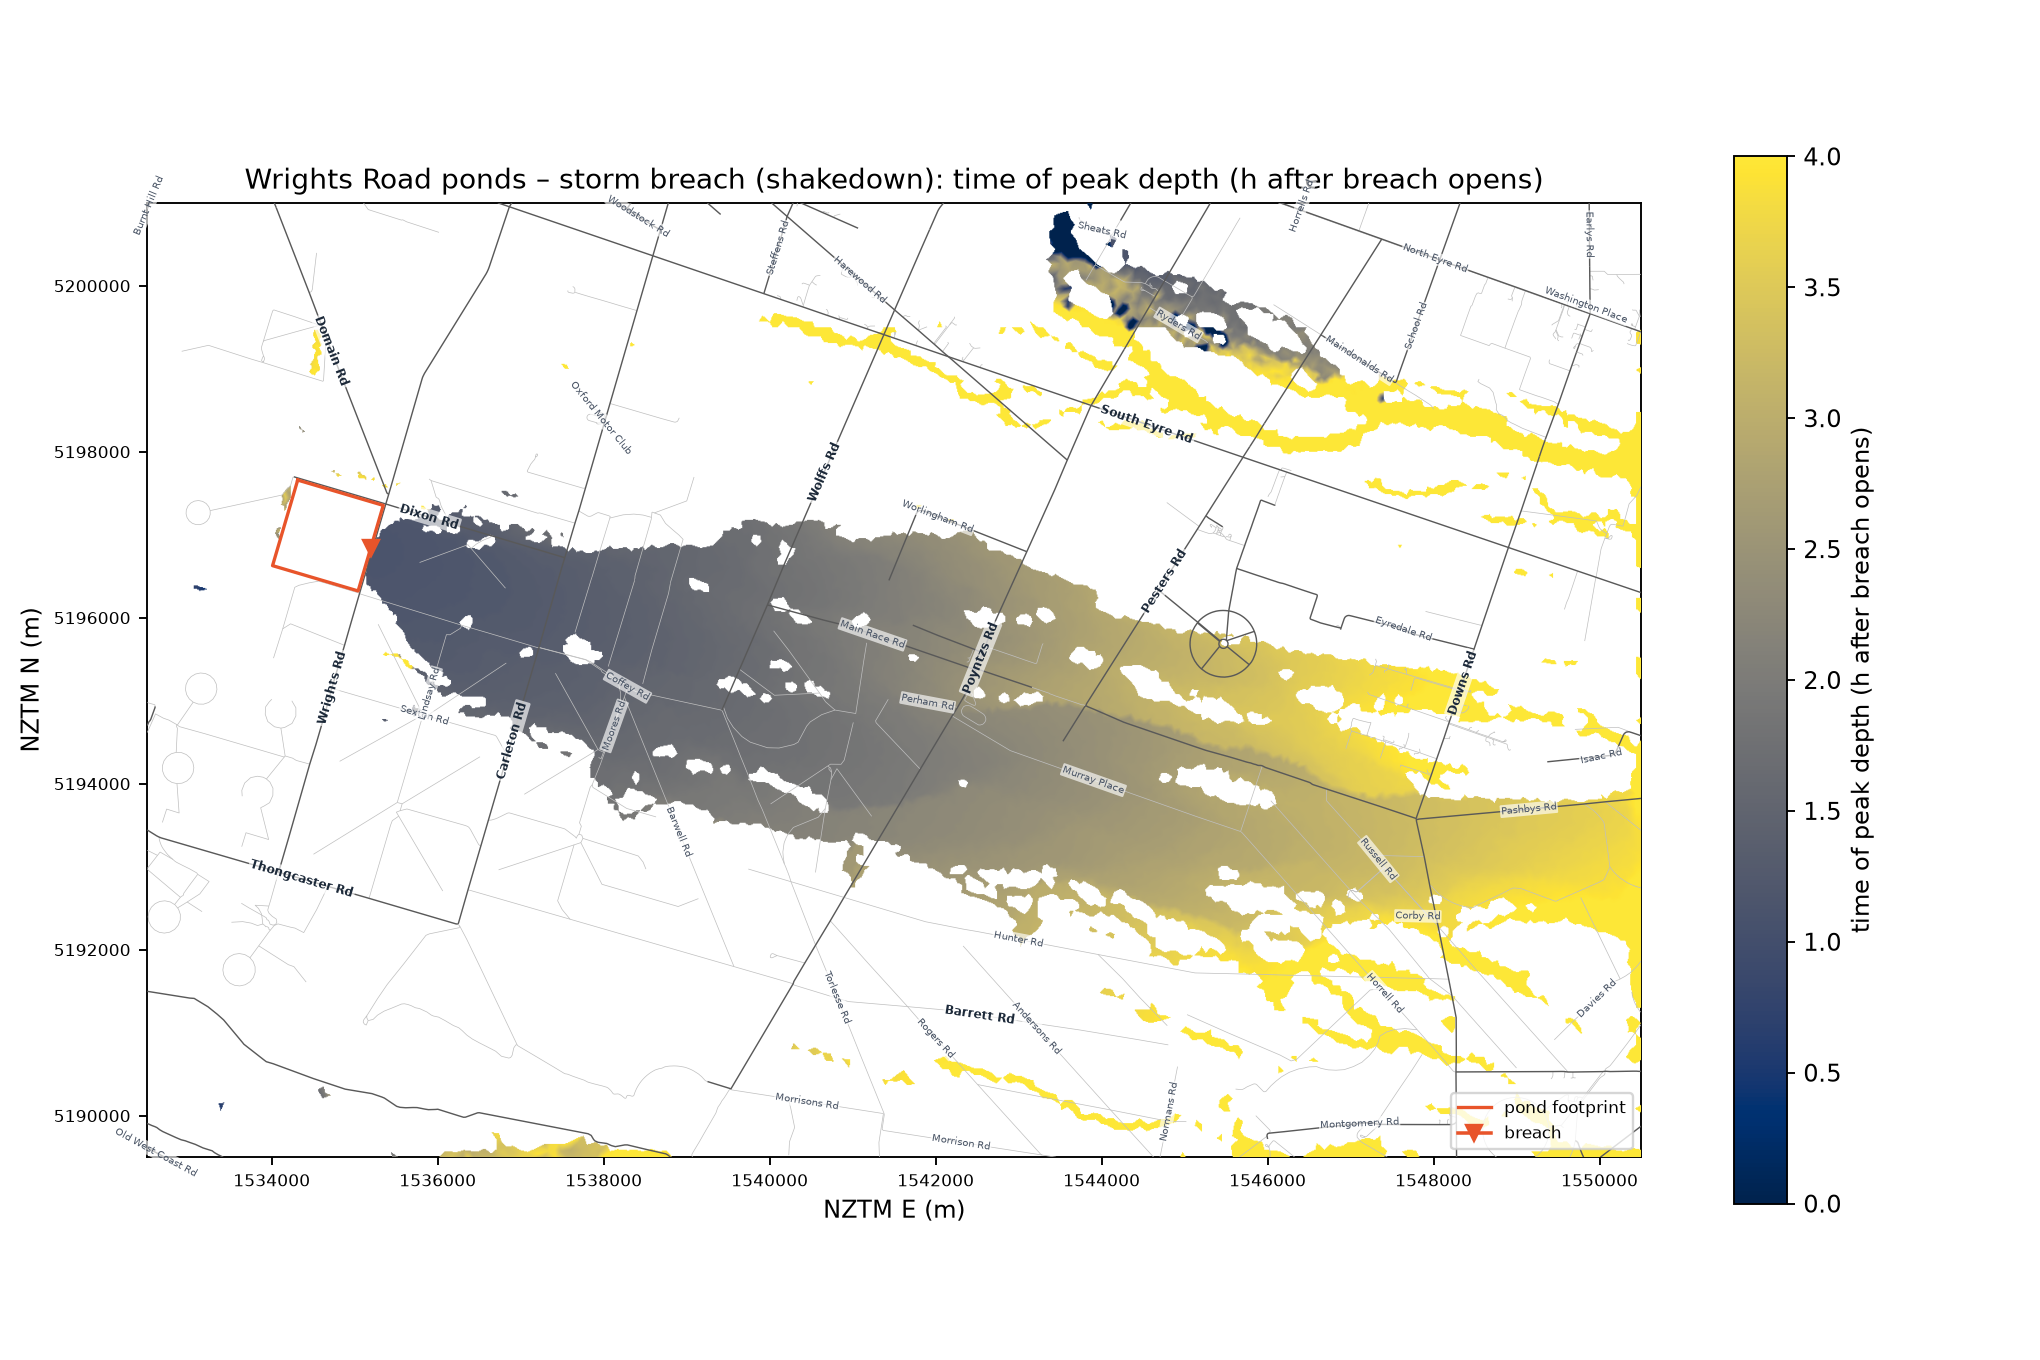
storm)NZSOLD "rainy day" combination: the east cascade breach (identical hydrograph, peak 2,098 m³/s) opens after 2 h of
steady 10 mm/h rain on saturated ground (no infiltration) with the Eyre River already carrying an assumed 150 m³/s
where it enters the domain. Breach-added figures are differenced against an identical storm run without the breach,
so rain and river water are not credited to the dam. Assumptions in config/dam.yaml: scenarios.storm and
docs/clg-notes.md (A9–A12); method SPEC §3.1 item 8. Time zero is the breach opening.
| Metric | Storm: everything | Storm: added by the breach | East cascade, dry (reference) |
|---|---|---|---|
| Inundated area > 0.1 m after 4 h (km²) | 56.6 | 43.4 | 39.5 |
| Deepest water (m) | 2.6 | – | 2.9 |
| Buildings > 0.1 m / ≥ 0.5 m | 608 / 113 | 477 / 75 | 439 / 95 |
| Buildings > H2 hazard | 112 | 84 | 94 |
| PAR screening (2.5 persons per at-risk building) | 283 | – | 238 |
Road arrival (h after the breach opens, first time the breach raises the depth by > 0.1 m above the storm-only run) and maximum total depth:
| Road | Storm arrival | East arrival | Storm depth (m) | East depth (m) |
|---|---|---|---|---|
| Carleton Road | 0.77 | 0.77 | 0.99 | 1.00 |
| Wolffs Road | 1.32 | 1.33 | 1.01 | 0.94 |
| Poyntzs Road | 1.83 | 1.90 | 1.08 | 0.75 |
| Pesters Road | 2.20 | 2.27 | 0.70 | 0.51 |
| Downs Road | 3.13 | 3.33 | 1.22 | 1.18 |
| Dixon Road | 1.03 | 0.96 | 0.73 | 0.70 |
Reading: the breach wave itself is barely faster on a wet plain (0–12 min earlier at Poyntzs–Downs Road), but it
spreads over 10 % more ground and is 0.05–0.35 m deeper where it meets the Eyre River and the ponded runoff east of
Poyntzs Road, because the river channel and the drains are already full. What changes most is the total picture
people would experience: 608 buildings with water against 439, and 113 rather than 95 with 0.5 m or more, since
the storm alone already wets 40 km² of the plain in this (very heavy, saturated-ground) rainfall assumption. The
storm-only baseline run is outputs/storm/storm_shakedown_nobreach.sww.
Mesh note: the storm runs use a repaired mesh (95,140 triangles, no sliver triangles – see SPEC §7.3). Re-running the east scenario on the repaired mesh changes its inundated area from 39.5 to 39.2 km², road arrivals by ≤ 2 min and buildings ≥ 0.5 m from 95 to 92, so the published east results were left as they are.
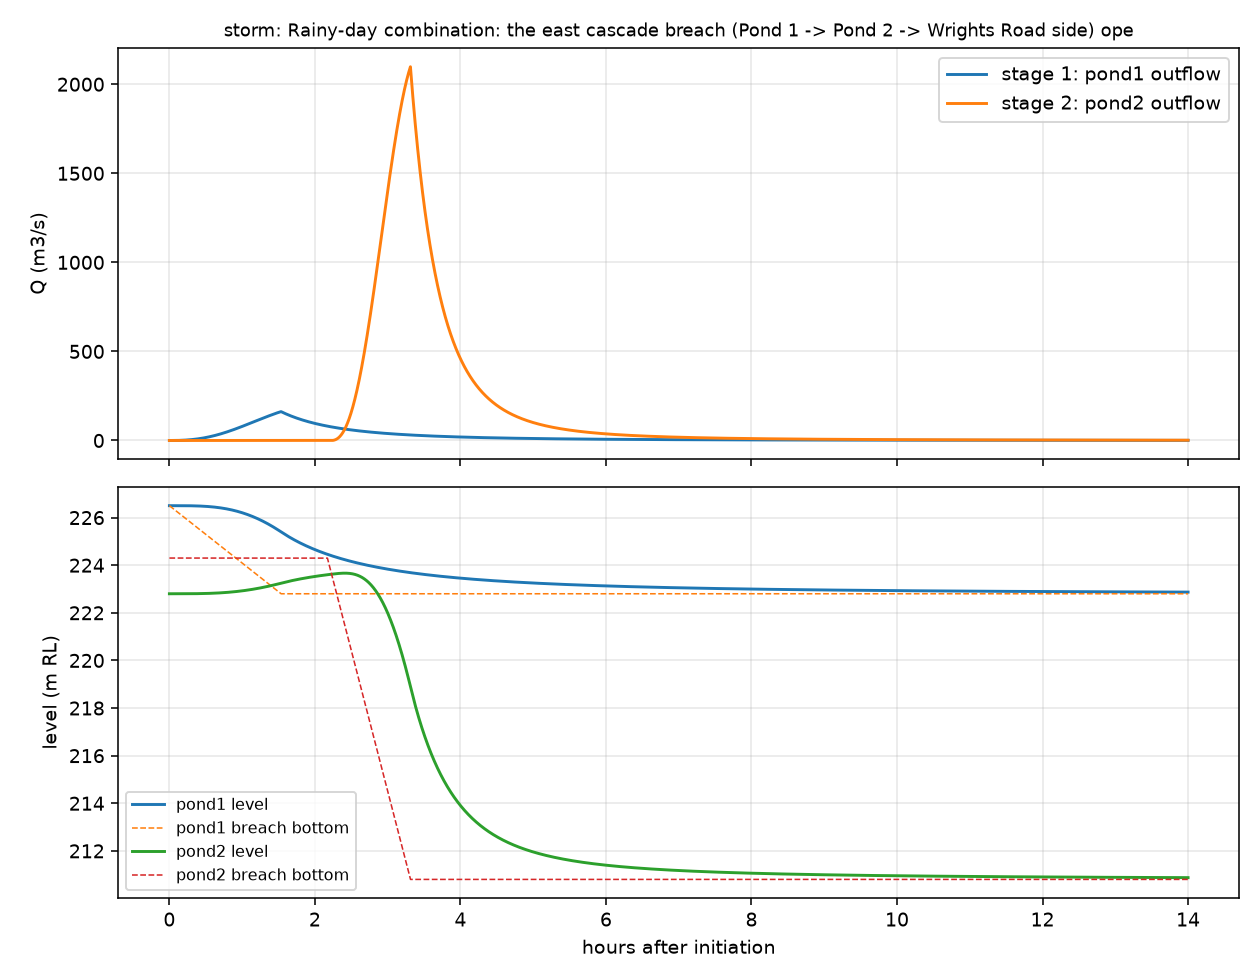
With the design report's volumes and areas, Pond 1 draining into Pond 2 statically equalises at ~223.8 m RL, 0.5 m below the Pond 2 crest (224.3 m). The overtopping cascade Damwatch describes therefore requires dynamic surge or a different stage–storage shape. The model initiates the Pond 2 breach at 223.6 m RL (config/dam.yaml: cascade.pond2_trigger_mRL); reconcile with Appendix H before any reportable use.